TCP and UDP Traffic Statistics
IPTraf also includes a facility that generates statistics on TCP and UDP traffic. This facility displays counts of all TCP and UDP packets with source or destination ports numbered less than 1024. Ports 1 to 1023 are reserved for the TCP/IP application protocols (well-known ports).
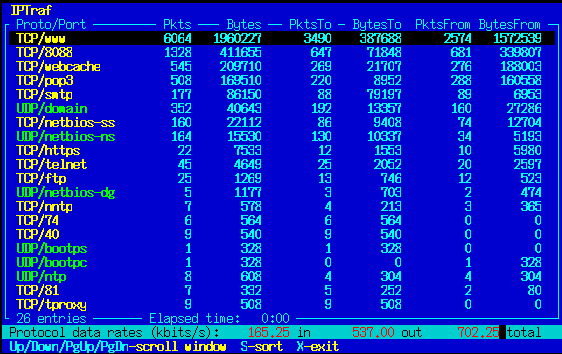
The statistics window indicates the protocol (TCP or UDP), the port number, the total packets and bytes counted for this particular protocol/port combination, the packets and bytes destined for that protocol and port, and the packets and bytes coming from that protocol and port.
Byte counts include the IP header and payload only. The data link header is not included.
The protocol/port indicators are color-coded for easier identification on color terminals. TCP indicators are in yellow, UDP in bright green.
Some network applications or protocols may use port numbers higher than 1023. Examples of these include application proxy servers (HTTP proxy servers typically use values like 8000, 8080, 8888, and the like), and IRC (IRC servers commonly accept connections on ports 6660 to 6669). These ports are by default not included in the counts. If you do want to include a higher-numbered port in the statistics, you can add them yourself from the Configure.../Additional ports... menu item. See the section below.
If logging is enabled, The statistics are also written to a log file (the default name is tcp_udp_services-iface.log, where iface is the selected interface (for example, tcp_udp_services-eth0.log).
IPTraf computes the total, incoming, outgoing, and data rates of the protocol currently indicated by the facility's highlight bar. The data rates are indicated at the bottom of the screen. If logging is enabled, the average data rates since the start of the facility are placed in the log file.
The Up and Down cursor keys move the highlight bar. Pressing X or Ctrl+X exits and returns to the main menu (or the shell if it was started from the command line).
Sorting TCP/UDP Entries
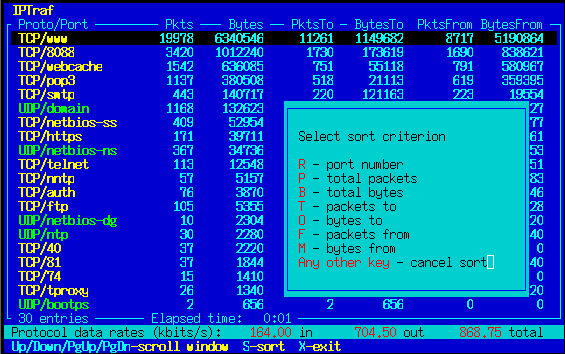
Pressing the S key brings up a window which allows you to select the field by which the entries will be sorted. You can press R to sort by port, P to sort by total packets, B to sort by total bytes, T to sort by incoming packets (packets to), O to sort by incoming bytes (bytes to), F to sort by outgoing packets (packets from) and M to sort by outgoing bytes (bytes from). Pressing any other key cancels the sort.
Port numbers are sorted in ascending order (least first) but statistics are sorted in descending order (largest counts first).
As with the IP traffic monitor, sorting is performed only with this sequence. Automatic sorting is not performed so as not to affect performance.
Additional Information
IPTraf's filters affect the output of this facility. See Chapter 7, Filters for more information about filters.
If you wish to start this facility from the command line, you can use the -s option followed by an interface to monitor. For example,
iptraf -s eth0 |
brings up this module for traffic on eth0. The interface must be specified, or IPTraf will drop back to the shell.