Configuring IPTraf
IPTraf can be easily configured with the Configure... item in the main menu. The configuration is stored in the /var/local/iptraf/iptraf.cfg file. If the file is not found, IPTraf uses the default settings. Any changes to the configuration immediately get stored in the configuration file.
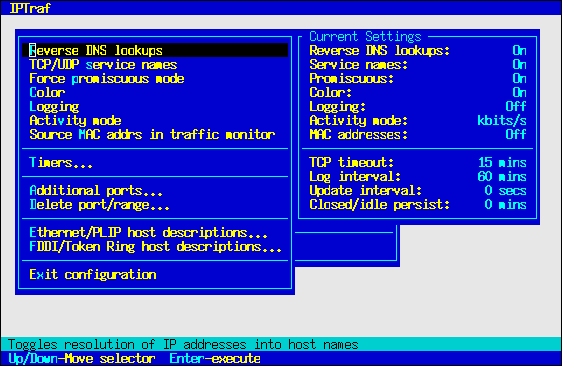
Toggles
Reverse DNS Lookups
Activating reverse lookup causes IPTraf to find out the name of the hosts with the addresses in the IP packets. When this option is enabled, IPTraf's IP traffic monitor starts the rvnamed DNS lookup server to help resolve IP addresses in the background while allowing IPTraf to continue capturing packets.
This option is off by default.
TCP/UDP Service Names
This option, when on, causes IPTraf to display the TCP/UDP service names (smtp, www, pop3, etc.) instead of their numeric ports (25, 80, 110, etc). The number-to-name mappings will depend on the systems services database file (usually /etc/services). Should there be no corresponding service name for the port number, the numeric form will still be displayed.
This setting is off by default.
 | Note |
|---|---|
Reverse lookup and service name lookup take some time and may impact performance and increase the chances of dropped packets. Performance and results are best (albeit more cryptic) with both these settings off. |
Force promiscuous
If this option is enabled, your LAN interfaces will capture all packets on your LAN. Using this option enables you to see all TCP connections and packets passing your LAN segment, even if they're not from or for your machine. When this option is active in the statistics windows, the Activity indicators will show a good estimate of the load on your LAN segment.
When this option is disabled, you'll only receive information about packets coming from and entering your machine.
The setting of this option affects all LAN ( Ethernet, FDDI, some Token Ring) interfaces on your machine, if you have more than one.
The interface's promiscuous flag is set only when a facility is started, and turned off when it exits. However, if promiscuous mode was already set when a facility was started, it remains set on exit.
If multiple instances of IPTraf are started, the promiscuous setting is restored only upon exit of the last facility.
| Note |
|---|---|
Do not use other programs that change the interface's promiscuous flag at the same time you're using IPTraf. The programs can interfere with each other's expected operations. While IPTraf now tries to obtain the initial setting of any promiscuous flags for restoration upon exit, other programs may not be as well-behaved, and they may turn off the promiscuous flags while IPTraf is still monitoring. |
Color
Turn this on with color monitors. Turn it off with black-and- white monitors or non-color terminals (like xterms). Changes to this setting will take effect the next time the program is started.
Color is on by default on consoles and color xterms, off on non-color terminals like xterms and VT100s.
Logging
When this option is active, IPTraf will log information to a disk file, which can be examined or analyzed later. Since IPTraf 2.4.0, IPTraf prompts you for the name of the file to which to write the logs. It will provide a default name, which you are free to accept or change. The IP traffic monitor and LAN station monitor will generate a log file name that is based on what instance they are (first, second, and so on). The general interface statistics' default log file name is constant, because it listens to all interfaces at once, and only one instance can run at one time.
The other facilities generate a log file name based on the interface they're listening on.
See the descriptions on the facilities above for the default log file names.
Press Enter to accept the log file name, or Ctrl+X to cancel. Canceling will turn logging off for that session.
The IP traffic monitor will write the following pieces of information to its log file:
Start of the traffic monitor
Receipt of the first TCP packet for a connection. If that packet is a SYN, (SYN) will be indicated in the log entry. (Of course, the traffic monitor may start in the middle of established connections. It will still count those packets. This also explains why some connection entries may become idle if the traffic monitor is started in the middle of a half-closed connection, and miss the first FIN. Such entries time out in a while.)
Receipt of a FIN (with average flow rate)
ACK of a FIN
Timeouts of TCP entries (with average flow rate)
Reset connections (with average flow rate)
Everything that appears in the bottom window of the traffic monitor
Stopping of the traffic monitor
Each log entry includes the date and time the entry was written. Logging is also affected by the defined filters.
Log files can grow very fast, so be prepared with plenty of free space and delete unneeded logs. Log write errors are not indicated.
Copies of the interface statistics, TCP/UDP statistics, packet size statistics, and LAN host statistics are also written to the log files at regular intervals. See Log Interval... in this chapter.
IPTraf closes and reopens the active log file when it receives a USR1 signal. This is useful in cases where a facility is run for long periods of time but the log files have to be cleared or moved.
To clear or move an active log file, rename it first. IPTraf will continue to write to the file despite the new name. Then use the UNIX kill command to send the running IPTraf process a USR1 signal. IPTraf will then close the log file and open another with the original name. You can then safely remove or delete the renamed file.
Do not delete an open log file. Doing so will only result in a file just as large but filled with null characters (ASCII code 0).
Logging comes disabled by default. The USR1 signal is caught only if logging is enabled, it is ignored otherwise.
Activity mode
Toggles activity indicators in the interface and LAN statistics facilities between kilobits per second (kbits/s) or kilobytes per second (kbytes/s).
The default setting is kilobits per second.
Source MAC addrs in traffic monitor
When enabled, the IP traffic monitor retrieves the packets' source MAC addresses if they came in on an Ethernet, FDDI, or PLIP interface. The addresses appear in the lower window for non-TCP packets, while for TCP connections, they can be viewed by pressing M.
No such information is displayed if the network interface doesn't use MAC addresses (such as PPP interfaces).
This can be used to determine the actual source of the packets on your local LAN.
The traffic monitor also logs the MAC addresses with this option enabled. The default setting is off.