Network Interface Statistics
There are two network interface statistics facilities: the general interface statistics, which displays a statistical summary of all attached interfaces, and the detailed interface statistics, which shows more statistical and load information about a single selected interface.
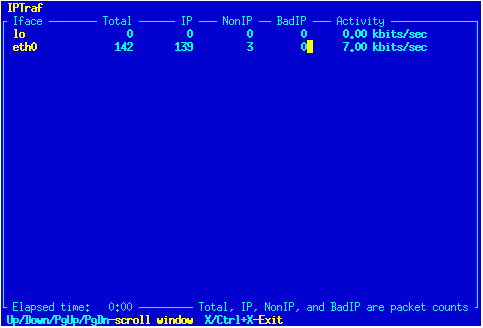
General Interface Statistics
The second menu option displays a list of attached network interfaces, and some general packet counts. Specifically, it displays counts of IP, non-IP, and bad IP packets (packets with IP checksum errors). It also includes an activity indicator, which shows the number of kilobits and packets the interface sees per second. All figures are for incoming and outgoing packets. (Again, considering promiscuous mode for LAN interfaces, which simply causes the machine to intercept all packets). This is useful for general monitoring of all attached interfaces. If byte counts and additional information are needed for a specific interface, the Detailed interface statistics option is also available.
The activity indicators can be toggled between kbits/s and kbytes/s with the Activity mode configuration option.
The general statistics window will dynamically add new entries as packets from newly-created interfaces (e.g. new PPP interfaces) are intercepted. Long lists can be scrolled with the Up, Down, PgUp, and PgDn keys.
This monitor is affected by IPTraf's filters as described in Chapter 7.
Copies of the statistics are written to the log file iface_stats_general.log at regular intervals if logging is enabled. See the Logging option int the Configuration chapter.
This facility can be started directly from the command line with the -g option to the iptraf command.
You can press X or Q to return to the main menu.