Detailed Interface Statistics
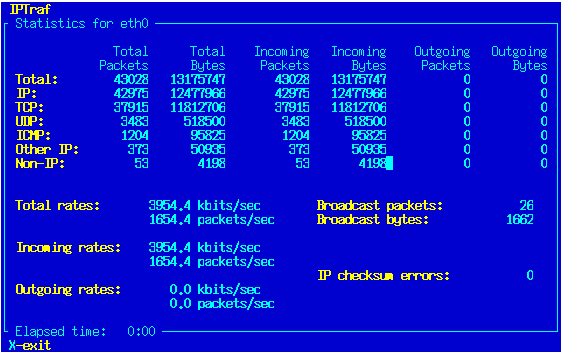
The third menu option displays packet statistics for any selected interface. It provides basically the same information as the General interface statistics option, with additional details. This facility provides the following information:
Total packet and byte counts
IP packet and byte counts
TCP packet and byte counts
UDP packet and byte count
ICMP packet and byte counts
Other IP-type packet and byte counts
Non-IP packet and byte counts
Checksum error count
Interface activity
Broadcast packet and byte counts
All IP byte counts (IP, TCP, UDP, ICMP, other IP) include IP header data and payload. The data link header is not included. The full frame length (including data-link header) is included in the non-IP and Total byte count. All data-link headers are also included in the Total byte counts.
The upper portion of the screen contains the packet and byte counts for all IP and non-IP packets intercepted on the interface. The lower portion contains the total, incoming, and outgoing interface data rates.
This facility also displays incoming and outgoing counts and data rates. The packet size breakdown in versions prior to 2.0.0 has been moved to its own facility under Statistical breakdowns.../By packet size as described in Chapter 5.
An outgoing packet is one that exits your interface, regardless of whether it originated from your machine or came from another machine and was routed through yours. An incoming packet is one that enters your interface, either addressed to you directly, broadcast, multicast, or captured promiscuously.
The rate indicators can be set to display kbits/s or kbytes/s with the Activity mode configuration option.
 | Note |
|---|---|
Buffering and some other factors may affect the data rates, notably the outgoing rate, causing it to reflect a higher figure than the actual rate at which the interface is sending. |
If you wish to start this facility directly from the command line, you can specify the -d parameter and an interface to monitor. For example,
iptraf -d eth0 |
starts the statistics for eth0. The interface must be specified, or IPTraf will not start the facility.
 | Note |
|---|---|
In both the general and detailed statistics screens, as well as in the IP traffic monitor, the packet counts are for actual network packets (layer 2), not the logical IP packets (layer 3) that may be reconstructed after fragmentation. That means, if a packet was fragmented into four pieces, and these four fragments pass over your interface, the packet counts will indicate four separate packets. |
The figure for the IP checksum errors is a packet count only, because the corrupted IP header cannot be relied upon to give a correct IP packet length value.
This facility's output is also affected by IPTraf's filters. See Chapter 7 for more information on filters.
The figures are logged at regular intervals if logging is enabled. The default log file name at the prompt is iface_stats_detailed-iface.log where iface is the selected interface for this session (for example, iface_stats_detailed-eth0.log).
Pressing X or Q takes you back to the main menu (if this facility was started with the command-line option, X or Q drops you back to the shell).
