The IP Traffic Monitor
Executing the first menu item or specifying -i to the iptraf command takes you to the IP traffic monitor. The traffic monitor is a real-time monitoring system that intercepts all packets on all detected network interfaces. The monitor decodes the IP information on all IP packets and displays the appropriate information about it, most notably the source and destination addresses. In addition to that, it also determines the encapsulated protocol within the IP packet, and displays some important information about that as well.
There are two windows in the traffic monitor. Both of them can be scrolled with the Up and Down cursor keys. Just press W to move the Active indicator to the window you want to control.
The Upper Window
The upper window of the traffic monitor displays the currently detected TCP connections. Information about TCP packets are displayed here. The window contains these pieces of information:
Source address and port
Packet count
Byte count
Source MAC address
Packet Size
Window Size
TCP flag statuses
Interface
 | Note |
|---|---|
Previous versions of IPTraf showed both the source and destination addresses on each line. IPTraf 2 shows only the source host:port combination to save on screen real estate. TCP connection endpoints are still indicated with the green brackets (on color terminals) along the left edge of the screen. |
The Up and Down cursor keys move an indicator bar between entries in the TCP monitor, scrolling the window if necessary. The PgUp and PgDn keys display the previous and next screenfuls of entries respectively.
The IP traffic monitor computes the data flow rate of the currently highlighted TCP flow and displays it on the lower-right corner of the screen. The flow rate is in kilobits or kilobytes per second depending on the Activity mode switch in the Configure... menu.
Because this monitoring system relies solely on packet information, it does not determine which endpoint initiated the connection. In other words, it does not determine which endpoint is the client, and which is the server. This is necessary because it can operate in promiscuous mode, and as such cannot determine the socket statuses for other machines on the LAN.
The system therefore displays two entries for each connection, one for each direction of the TCP connection. To make it easier to determine the direction pairs of each connection, a bracket is used to "join" both together. This bracket appears at the leftmost part of each entry.
Just because a host entry appears at the upper end of a connection bracket doesn't mean it was the initiator of the connection.
Each entry in the window contains these fields:
- Source address and port
The source address and port indicator is in address:port format. This indicates the source machine and TCP port on that machine from which this data is coming.
The destination is the host:port at the other end of the bracket.
- Packet count
The number of packets received for this direction of the TCP connection
- Byte count
The number of bytes received for this direction of the TCP connection. These bytes include total IP and TCP header information, in addition to the actual data. Data link header (e.g. Ethernet and FDDI) data are not included.
- Source MAC address
The address of the host on your local LAN that delivered this packet. This can be viewed by pressing M once if Source MAC addrs in traffic monitor is enabled in the Configure... menu.
- Packet Size
The size of the most recently received packet. This item is visible if you press M for more TCP information. This is the size of the IP datagram only, not including the data link header.
- Window Size
The advertised window size of the most recently received packet. This item is visible if you press M for more TCP information.
- Flag statuses
The flags of the most recently received packet.
- S
SYN. A synchronization is taking place in preparation for connection establishment. If only an S is present (S---) the source is trying to initiate a connection. If an A is also present (S-A-), this is an acknowledgment of a previous connection request, and is responding.
- A
ACK. This is an acknowledgment of a previously received packet
- P
PSH. A request to push all data to the top of the receiving queue
- U
URG. This packet contains urgent data
- RESET
RST. The source machine indicated in this direction reset the entire connection. The direction entries for reset connections become available for new connections.
- DONE
The connection is done sending data in this direction, and has sent a FIN (finished) packet, but has not yet been acknowledged by the other host.
- CLOSED
The FIN has been acknowledged by the other host. When both directions of a connection are marked CLOSED, the entries they occupy become available for new connection entries.
- -
The flag is not set
Some other pieces of information can be viewed as well. The M key displays more TCP information. Pressing M once displays the MAC addresses of the LAN hosts that delivered the packets (if the Source MAC addrs in traffic monitor option is enabled in the Configure... menu). N/A is displayed if no packets have been received from the source yet, or if the interface doesn't support MAC addresses (such as PPP interfaces).
If the Source MAC addrs in traffic monitor option is not enabled, pressing M simply toggles between the counts and the packet and window sizes.
By default, only IP addresses are displayed, but if you have access to a name server or host table, you may enable reverse lookup for the IP addresses. Just enable reverse lookup in the Configure... menu.
 | Tip |
|---|---|
If you notice unusual SYN activity (too many initial (S---) but frozen SYN entries, or rapidly increasing initial SYN packets for a single connection), you may be under a SYN flooding attack or TCP port scan. Apply appropriate measures, or the targeted machines may begin denying network services. |
Entries not updated within a user-configurable amount of time may get replaced with new connections. The default time is 15 minutes. This is regardless of whether the connection is closed or not. (Some unclosed connections may be due to extremely slow links or crashes at either end of the connection.) This figure can be changed at the Configure... menu.
Some early entries may have a > symbol in front of its packet count. This means the connection was already established when the monitor started. In other words, the figures indicated do not reflect the counts since the start of the TCP connection, but rather, since the start of the traffic monitor. Eventually, these > entries will close (or time out) and disappear. TCP entries without the > were initiated after the traffic monitor started, and the counts indicate the totals of the connection itself. Just consider entries with > partial.
Some > entries may go idle if the traffic monitor was started when these connections were already half-closed (FIN sent by one host, but data still being sent by the other). This is because the traffic monitor cannot determine if a connection was already half-closed when it started. These entries will eventually time out. (To minimize these entries, an entry is not added by the monitor until a packet with data or a SYN packet is received.)
Direction entries also become available for reuse if an ICMP Destination Unreachable message is received for the connection.
The lower part of the screen contains a summary line showing the IP, TCP, UDP, ICMP, and non-IP byte counts since the start of the monitor. The IP, TCP, UDP, and ICMP counts include only the IP datagram header and data, not the data-link headers. The non-IP count includes the data-link headers.
| Technical note: IP Forwarding and Masquerading |
|---|---|
Previous versions of IPTraf issued a warning if the kernel had IP masquerading enabled due to the way the kernel masqueraded and translated the IP addresses. The new kernels no longer do it as before and IPTraf now gives output properly on masquerading machines. The -q parameter is no longer required to suppress the warning screen. On forwarding (non-masquerading) machines packets and TCP connections simply appear twice, one each for the incoming and outgoing interfaces if all interafaces are being monitored. On masquerading machines, packets and connections from the internal network to the external network also appear twice, one for the internal and external interface. Packets coming from the internal network will be indicated as coming from the internal IP address that sourced them, and also as coming from the IP address of the external interface on your masquerading machine. In much the same way, packets coming in from the external network will look like they're destined for the external interface's IP address, and again as destined for the final host on the internal network. |
Closed/Idle/Timed Out Connections
A TCP connection entry that closes, gets reset, or stays idle too long normally get replaced with new connections. However, if these get too many, active connections may become interspersed among closed, reset, or idle entries.
IPTraf can be set to automatically remove all closed, reset, and idle entries with the TCP closed/idle persistence... configuration option. You can also press the F key to immediately clear them at any time.
| Note |
|---|---|
The TCP timeout... option only tells IPTraf how long it should take before a connection should be considered idle and open to replacement by new connections. This does not determine how long it remains on-screen. The TCP closed/idle persistence... parameter flushes entries that have been idle for the number of minutes defined by the TCP timeout... option. |
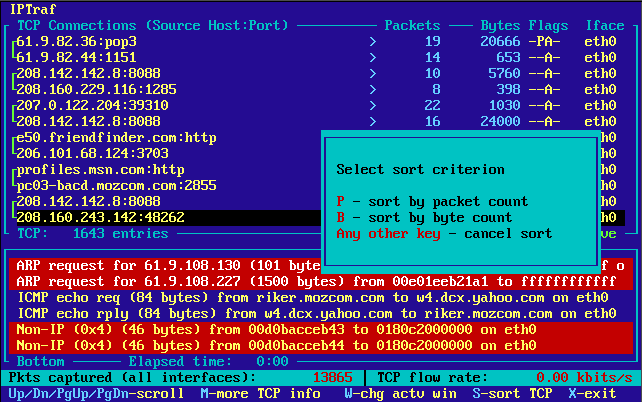
Sorting TCP Entries
The TCP connection entries can be sorted by pressing the S key, then by selecting a sort criterion. Pressing S will display a box showing the available sort criteria. Press P to sort by packet count, B to sort by byte count. Pressing any other key will cancel the sort.
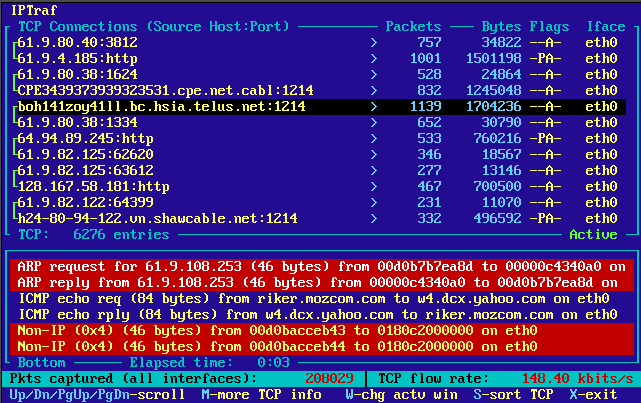
The sort operation compares the larger values in each connection entry pair and sorts the counts in descending order.
Over time, the entries will go out of order as counts proceed at varying rates. Sorting is not done automatically so as not to degrade performance.