Version 2.6.1
Permission is granted to reproduce and distribute this document with the included software under the terms of the GNU General Public License. This manual and the software that accompanies it come with absolutely no warranty, not even the implied warranties of merchantability or fitness for any particular purpose. See the included COPYING file for details.
Additional information appears in shaded boxes. These are classifed as Notes,
Tips, or Technical Notes.
Notes are additional pieces of information that may be useful or may
clarify the preceeding paragraphs of the manual.
Tips provide shortcuts or clarify tasks that may not be immediately obvious.
Technical notes are explanations of a more technical nature and may
be of more use to programmers and advanced users.
IPTraf can be used to monitor the load on an IP network,
the most used types of network services, the proceedings of
TCP connections, and others.
IPTraf is a software-only analyzer, and utilizes the built-in raw
packet capture interface of the Linux kernel, allowing it to
be used with a wide range of Ethernet cards, supported FDDI adapters,
supported ISDN adapters, Token Ring, asynchronous SLIP/PPP interfaces and others
network devices. No
special hardware is required.
Basic knowledge of the important TCP/IP protocols (IP, TCP, UDP, ICMP,
etc.) is necessary for you to best understand the information generated by
the program.
The software is available in source form in compressed .tar.gz files
named iptraf-x.y.z.tar.gz where x.y.z is the
version number. Precompiled ready-to-run software is available in the
iptraf-x.y.z.machinetype.bin.tar.gz files.
(machinetype indicates what platform the precompiled binaries
run on. The official distribution will only be for the Intel x86 architecture
indicated as i386.)
You will need to have GNU tar and GNU zip installed. All modern Linux
installations already have these utilities ready.
or
tar zxvf iptraf-x.y.z.i386.bin.tar.gz (precompiled x86 programs)
If your tar doesn't support the z option, you can
separately decompress the .tar.gz file then extract the resulting
.tar archive.
This will decompress the sources into a directory called
iptraf-x.y.z (source code) or iptraf-x.y.z.bin
(precompiled).
while you are logged in as root. The Setup script will recognize the
source distribution and compile the software before installing. It will
immediately install a precompiled distribution.
The resulting binaries will be placed in the /usr/local/bin
directory. All needed directories will also be created.
After installation, you will be asked if you want to read the RELEASE-NOTES
file. It is recommended that you do so at that point, since the
RELEASE-NOTES file contains important information about the new version.
This assumes your floppy is in /dev/fd0. You can use any
empty directory in place of /mnt. With most Linux
installations, this will work fine.
while logged in as root. Setup will determine whether the diskette contains
a source code distribution or ready-to-run precompiled software.
This will copy the binaries to /usr/local/bin, and create
the necessary working directories.
(That's umount, not unmount.)
You can then eject the diskette. Store it in a safe
place.
You will also be asked if you want to view the RELEASE-NOTES file. It is
recommended that you do so at that point.
In both cases (downloaded and floppy), the installation will
store the program in /usr/local/bin with the binaries owned by
user root, readable, writable, and executable by the owner,
no permissions for the group, no permissions for all others.
(700 octal, or -rwx------).
For Additional Information
See the included README file for summarized and late-breaking information.
Also read the RELEASE-NOTES file for important new information about this
new version. The CHANGES file contains a record of the changes made to
the software since
1.0.0. README.rvnamed contains information on the rvnamed reverse
resolution program. See the other README files for support and
development information.
Document Conventions
The following symbols and typefaces are used throughout this manual:
Introduction
IPTraf is a network monitoring utility for IP networks. It
intercepts packets on the network and gives out various pieces
of information about the current IP traffic over it.
Information returned by IPTraf include:
Installation
IPTraf is most readily available on the Internet, but some
may receive it on a diskette. Here are the instructions for
both types of distributions.
System Requirements
IPTraf requires:
Availability
IPTraf can be downloaded from the Internet from the official FTP site
at ftp://iptraf.seul.org/pub/iptraf/.
Installing Downloaded Packages
(source and precompiled)
tar zxvf iptraf-x.y.z.tar.gz (source code)
gunzip iptraf-x.y.z.tar.gz
tar xvf iptraf-x.y.z.tar
(x.y.z here should be the IPTraf version number you're
installing, like 2.6.1).
./Setup
Installing a Floppy Distribution
If you received IPTraf on a diskette, the sources are
already decompressed. The diskette is in Second Extended
filesystem format. Perform the following steps to install
the software.
mount -t ext2 /dev/fd0 /mnt
./Setup
umount /mnt
Note You must be root to do the installation. The old style of installation (cd src;make install) is still supported. |
Be sure /usr/local/bin is included in your environment's
PATH variable. You can edit the appropriate command in your login
customization file (.profile for the Bourne-type shells,
.cshrc for the C shells and its relatives).
The filter state information for all filters has been merged into a
single file. The addition of better criteria in the miscellaneous IP
filters also required the change in filter state file format. There
is no need to redefine your existing TCP and UDP filters, but IPTraf 2.5
will not use the last filters you applied with the previous versions.
Just re-apply them before you run the IP traffic monitor.
Since the simple filter toggles for other IP protocols have been replaced
with better filter definitions, they will have to define them if you wish
to filter these protocols as described in the filters
section.
Also verify the settings for ARP, RARP, and non-IP filter toggles before
running the IP traffic monitor for the first time.
Upgrading from Earlier Versions
If you're running IPTraf 2.0.x or earlier, and you're using TCP/UDP
filters, do a "make upgrade" procedure. Versions 1.4.x and 2.0.x
erroneously placed the filter data files in a wrong directory due to a
filename parsing bug.
Note IPTraf does not yet have a SIGWINCH handler, and does not adjust itself when an xterm or some other X terminal is resized. |
Technical note
IPTraf needs to refer to the terminfo database in
/usr/share/terminfo. If the supplied executable program fails
with "Error opening terminal", your terminfo database may be located
somewhere
else. You can control the terminfo search path by using the TERMINFO
environment variable. For example, if you're using the sh or bash shell,
and your terminfo database is in /usr/lib/terminfo (typical for
Slackware
distributions), you can use the commands:
export TERMINFO You can place these commands in your ~/.profile or the systemwide /etc/profile startup files. You can also create a symbolic link named /usr/share/terminfo to let it point to your existing terminfo (assuming again your terminfo is in /usr/lib/terminfo):
Or you can recompile your program to use your existing ncurses library installation. If you do this, make sure you have ncurses 4.2 or later. |
The following command-line parameters can be supplied to the
iptraf command:
If this parameter is not specified, the facility runs until the exit
keystroke is pressed.
The -f parameter overrides the existing locks and counters imposed
by the IPTraf process and by the various facilities, causing this instance to think it is
the first and that there are no other facilities running. Use this
parameter with great caution. A common use for this parameter is to recover
from abrupt or abnormal terminations which may leave stale locks and
counters still lying around.
The -f parameter may be used together with the others.
While the command-line options are case-sensitive, interactive keystroke at
the IPTraf full-screen interface are not.
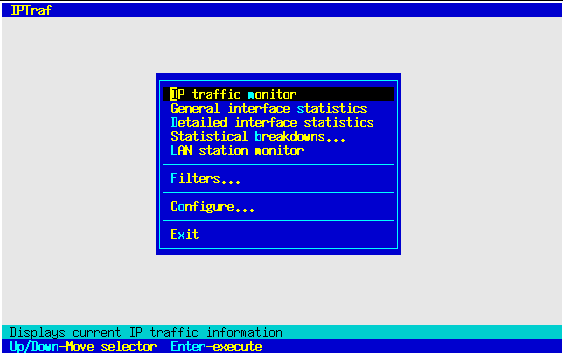
Use the Up and Down arrow keys on your keyboard to move the selection bar.
Press Enter to execute the selected item.
Alternatively, you can also directly press the highlighted letter of the
item you want. This will immediately execute the option.
When started with one of the command-line options to directly start a
statistical facility, pressing X or Q will exit the facility directly,
without any confirmation. The -t command-line parameter will
automatically exit the facility after the specified length of time
without any confirmation as well. Daemon facilities started with the -B
parameter will immediately terminate after being sent a USR2 signal. See
the section on Background Operation below
for more information.
Command-line Options
IPTraf has a few optional command-line parameters. As with most UNIX
commands, IPTraf command-line parameters are case-sensitive (-l
is NOT the same as -L).
Using the Menus
Menu items with a trailing ellipsis
(...) either pop up a submenu with further items, or require additional
information before it can complete the task and return to the menu. Menu
items without an ellipsis execute immediately.
Exiting IPTraf
When started up in interactive mode, IPTraf can be exited with the Exit command
in the main menu. IPTraf will display a window asking you to confirm the exit.
Just press Enter to exit back to your shell, or any other key to remain in
IPTraf.
Using IPTraf
General Information
The following sections document the various statistics facilities. The
default behavior is to return counts in as close to real time as possible,
although this may be adjusted at the Configure... menu.
1024067 | exactly 1024067 |
1024K | approximately 1024000 |
1024M | approximately 1024000000 |
1024G | approximately 1024000000000 |
1024T | approximately 1024000000000000 |
These notations apply to both packet and byte counts.
Because of this relaxation, each instance now generates log files with
unique names for instances, depending on either their instance or the
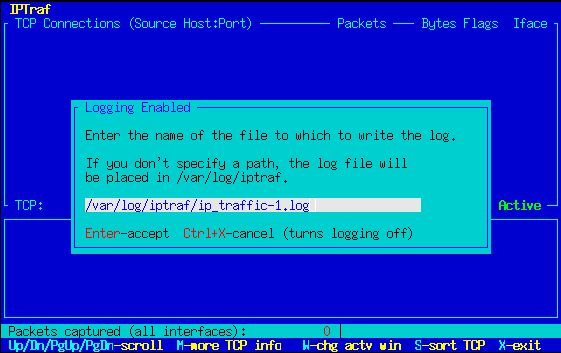
interface they're listening on. If the Logging option is turned on
(see Configuration section below), IPTraf will
prompt you for a log file name while presenting a default. You may accept
this default or change it. Press Enter to accept, or Ctrl+X to cancel.
Canceling will turn logging off for that particular session.
If you don't specify an absolute path, the log file will be placed in
/var/log/iptraf.
See the Logging
section below for detailed information on logging. See also the
documentation on each statistical facility for the default log file names.
The default log file names will also be used if the -B parameter is
used to run IPTraf in the background. You can override the defaults with
the -L parameter. See the section on Background Operation below.
See the Screen update interval... configuration option under the
Configuration section of this manual.
Your system's network interfaces must be named according to the schemes
specified above.
Instances and Logging
Starting with version 2.4, IPTraf allows multiple instances of the
facilities at the
same time in different processes
(for example, you can now run more than two or more IP Traffic
Monitors at the same time), although only one can listen on a specific
interface or all interfaces at once. This applies to all facilities except
the General Interface Statistics, which is still restricted to only one
instance at a time.
Screen Update Delays
Older versions of IPTraf updated the screen as soon as a packet was received.
However, screen updates are one of the slowest operations the program
performs. Since version 1.3, a configuration option has been available
to
control screen update speed.
Supported Network Interfaces
IPTraf currently supports the following network interface types and names.
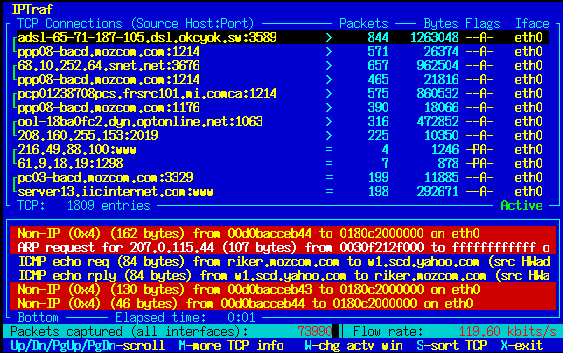
Note Previous versions of IPTraf showed both the source and destination addresses on each line. IPTraf 2 shows only the source host:port combination to save on screen real estate. TCP connection endpoints are still indicated with the green brackets (on color terminals) along the left edge of the screen. |
The Up and Down cursor keys move an indicator bar between entries in the TCP monitor, scrolling the window if necessary. The PgUp and PgDn keys display the previous and next screenfuls of entries respectively.
The IP traffic monitor computes the data flow rate of the currently highlighted TCP flow and displays it on the lower-right corner of the screen. The flow rate is in kilobits or kilobytes per second depending on the Activity mode switch in the Configure... menu.
Because this monitoring system relies solely on packet information, it does not determine which endpoint initiated the connection. In other words, it does not determine which endpoint is the client, and which is the server. This is necessary because it can operate in promiscuous mode, and as such cannot determine the socket statuses for other machines on the LAN.
The system therefore displays two entries for each connection, one for each direction of the TCP connection. To make it easier to determine the direction pairs of each connection, a bracket is used to "join" both together. This bracket appears at the leftmost part of each entry.
Just because a host entry appears at the upper end of a connection bracket doesn't mean it was the initiator of the connection.
Each entry in the window contains these fields:
Source address and port
The source address and port indicator is in address:port format.
This indicates the source machine and TCP port on that machine
from which this data is coming.
The destination is the host:port at the other end of the bracket.
Packet count
The number of packets received for this direction of the
TCP connection
Byte count
The number of bytes received for this direction of the TCP
connection. These bytes include total IP and TCP header information,
in addition to the actual data. Data link header (e.g. Ethernet and FDDI)
data are not included.
Source MAC address
The address of the host on your local LAN that delivered this packet. This
can be viewed by pressing M once if Source MAC addrs in traffic
monitor is enabled in the Configure... menu.
Packet Size
The size of the most recently received packet. This item is visible
if you press M for more TCP information. This is the size of the IP
datagram only, not including the data link header.
Window Size
The advertised window size of the most recently received packet. This
item is visible if you press M for more TCP information.
Flag statuses
The flags of the most recently received packet.
Some other pieces of information can be viewed as well. The M key displays more TCP information. Pressing M once displays the MAC addresses of the LAN hosts that delivered the packets (if the Source MAC addrs in traffic monitor option is enabled in the Configure... menu). N/A is displayed if no packets have been received from the source yet, or if the interface doesn't support MAC addresses (such as PPP interfaces).
If the Source MAC addrs in traffic monitor option is not enabled, pressing M simply toggles between the counts and the packet and window sizes.
By default, only IP addresses are displayed, but if you have access to a name server or host table, you may enable reverse lookup for the IP addresses. Just enable reverse lookup in the Configure... menu.
The rvnamed ProcessThe IP traffic monitor starts a daemon called rvnamed to help speed up reverse lookups without sacrificing too much keyboard control and accuracy of the counts. While reverse lookup is being conducted in the background, IP addresses will be used until the resolution is complete.If for some reason rvnamed cannot start (probably due to improper installation or lack of memory), and you are on the Internet, and you enable reverse lookup, your keyboard control can become very slow. This is because the standard lookup functions do not return until they have completed their tasks, and it can take several seconds for a name resolution in the foreground to complete. rvnamed will spawn up to 200 children to process reverse DNS queries. |
Tip If you notice unusual SYN activity (too many initial (S---) but frozen SYN entries, or rapidly increasing initial SYN packets for a single connection), you may be under a SYN flooding attack. Apply appropriate measures, or the targeted machine may begin denying network services. |
Entries not updated within a user-configurable amount of time may get replaced with new connections. The default time is 15 minutes. This is regardless of whether the connection is closed or not. (Some unclosed connections may be due to extremely slow links or crashes at either end of the connection.) This figure can be changed at the Configure... menu.
Some early entries may have a > symbol in front of its packet count. This means the connection was already established when the monitor started. In other words, the figures indicated do not reflect the counts since the start of the TCP connection, but rather, since the start of the traffic monitor. Eventually, these > entries will close (or time out) and disappear. TCP entries without the > were initiated after the traffic monitor started, and the counts indicate the totals of the connection itself. Just consider entries with > partial.
Some > entries may go idle if the traffic monitor was started when these connections were already half-closed (FIN sent by one host, but data still being sent by the other). This is because the traffic monitor cannot determine if a connection was already half-closed when it started. These entries will eventually time out. (To minimize these entries, an entry is not added by the monitor until a packet with data or a SYN packet is received.)
Direction entries also become available for reuse if an ICMP Destination Unreachable message is received for the connection.
The lower part of the screen contains a summary line showing the IP, TCP, UDP, ICMP, and non-IP byte counts since the start of the monitor. The IP, TCP, UDP, and ICMP counts include only the IP datagram header and data, not the data-link headers. The non-IP count includes the data-link headers.
Technical note: IP Forwarding and MasqueradingPrevious versions of IPTraf issued a warning if the kernel had IP Masquerading enabled due to the way the kernel masqueraded and translated the IP addresses. The new kernels no longer do it as before and IPTraf now gives output properly on masquerading machines. The -q parameter is no longer required to suppress the warning screen.On forwarding (non-masquerading) machines packets and TCP connections simply appear twice, one each for the incoming and outgoing interfaces. On masquerading machines, packets and connections from the internal network to the external network also appear twice, one for the internal and external interface. Packets coming from the internal network will be indicated as coming from the internal IP address that sourced them, and also as coming from the IP address of the external interface on your masquerading machine. In much the same way, packets coming in from the external network will look like they're destined for the external interface's IP address, and again as destined for the final host on the internal network. |
Closed/Idle/Timed Out Connections
A TCP connection entry that closes, gets reset, or stays idle too long
normally get replaced with new connections. However, if these get too many,
active connections may become interspersed among closed, reset, or idle
entries.
IPTraf can be set to automatically remove all closed, reset, and idle entries with the TCP closed/idle persistence... configuration option. You can also press the F key to immediately clear them at any time.
Note The TCP timeout... option only tells IPTraf how long it should take before a connection should be considered idle and open to replacement by new connections. This does not determine how long it remain s on-screen. The TCP closed/idle persistence... parameter flushes entries that have been idle for the number of minutes defined by the TCP timeout... option. |
Sorting TCP Entries
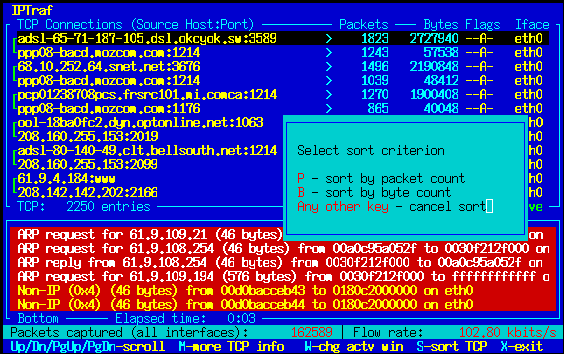
The TCP connection entries can be sorted by pressing the S key, then by
selecting a sort criterion. Pressing S will display a box showing the
available sort criteria. Press P to sort by packet count, B to sort by byte
count. Pressing any other key will cancel the sort.
The sort operation compares the larger values in each connection entry pair and sorts the counts in descending order.
Over time, the entries will go out of order as counts proceed at varying rates. Sorting is not done automatically so as not to degrade performance.
Note
The source and destination addresses for ARP and RARP entries
are MAC addresses.
Strictly speaking, ARP and RARP packets aren't IP packets, since they are not encapsulated in an IP datagram. They're just indicated because they are integral to proper IP operation on LANs. |
For all packets in the lower window, only the first IP fragment is indicated (since that contains the header of the IP-encapsulated protocol) but with no further information from the encapsulated protocol.
UDP packets are also displayed in address:port format. ICMP entries also contain the ICMP message type. For easier location, each type of protocol is color-coded (only on color terminals such as the Linux console).
UDP | Red on White |
ICMP | Yellow on Blue |
OSPF | Black on Cyan |
IGRP | Bright white on Cyan |
IGP | Red on Cyan |
IGMP | Bright green on Blue |
GRE | Blue on White |
ARP | Bright white on Red |
RARP | Bright white on Red |
Other IP | Yellow on Red |
Non-IP | Yellow on Red |
The lower window can hold up to 512 entries. You can scroll the lower window by using the W key to move the Active indicator to it, and by using the Up and Down cursor keys. The lower window automatically scrolls every time a new entry is added, and either the first entry or last entry is visible. Upon reaching 512 entries, old entries are thrown out as new entries are added.
Some entries may be too long to completely fit in a screen line. You can use the Left and Right cursor keys to vertically scroll the lower window when it is marked Active.
Entries for packets received on LAN interfaces also include the source MAC address of the LAN host which delivered it. This behavior is enabled by turning on the Source MAC addrs in traffic monitor toggle in the Configure... menu.
Entry Details
In general, the entries in the lower window indicate the
protocol, the IP datagram size (full frame size for non-IP, including ARP
and RARP), the source address, the destination address,
and the network interface the packet was detected on. However, some
protocols have a little more information.
ICMP: ICMP entries are displayed in this format:
ICMP type (subtype) (size bytes) from source to destination [(src HWaddr srcMACaddress)] on interface
where type could be any of the following:
The destination unreachable message also includes information on the type of error encountered. Here are the destination unreachable codes:
For more information on ICMP, see RFC 792.
OSPF: OSPF messages also include a little more information. The format of an OSPF message in the window is:
OSPF type (a=area r=router) (size bytes) from source to destination [(src HWaddr srcMACaddress)] on interface
The type can be one of the following:
The entries in parentheses:
Many times, the destination addresses for OSPF packets are class D multicast addresses in standard dotted decimal notation or (if reverse lookup is enabled), hosts under the MCAST.NET domain. Such multicast addresses are defined as follows:
See RFC 1247 for details on the OSPF protocol.
With logging enabled, the IP traffic monitor prompts you for a log file name. The default name is ip_traffic-n.log (where n is what instance of the traffic monitor this is (1, 2, 3, and so on). (e.g. if this is the first instance, the default file name will be ip_traffic-1.log.)
At any time, you can press X or Q to return to the main menu (or back to the shell if the monitor was started with iptraf -i).
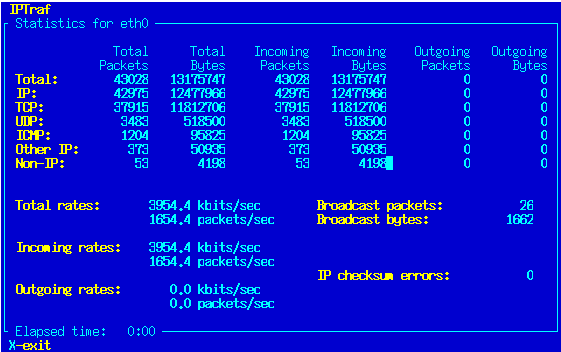
Note Buffering and some other factors may affect the data rates, notably the outgoing rate, causing it to reflect a higher figure than the actual rate at which the interface is sending. |
If you wish to start this facility directly from the command line, you can specify the -d parameter and an interface to monitor. For example,
starts the statistics for eth0. The interface must be specified, or IPTraf will not start the facility.
Note
In both the general and detailed statistics screens, as well
as in the IP traffic monitor, the packet counts are for
actual network packets (layer 2), not the logical IP packets
(layer 3) that may be reconstructed after fragmentation.
That means, if a packet was fragmented into four pieces, and
these four fragments pass over your interface, the packet
counts will indicate four separate packets.
The figure for the IP checksum error is a packet count only, because the corrupted IP header cannot be relied upon to give a correct IP packet length value. |
The figures are logged at regular intervals if logging is enabled. The default log file name at the prompt is iface_stats_detailed-iface.log where iface is the selected interface for this session (for example, iface_stats_detailed-eth0.log).
Pressing X or Q takes you back to the main menu (if this facility was started with the command-line option, X or Q drops you back to the shell).
The packet size breakdown takes the interface's Maximum Transmission Unit
(MTU) size and divides it into 20 brackets, each bracket containing a
range of sizes. As a packet is captured, its size is determined and the
appropriate bracket is incremented.
This facility provides an idea as to the packet sizes passing over your
network, and can aid in network (re)design decisions.
If logging is enabled, copies of the statistics are written at regular
intervals to a log file. The default log file name
is packet_size-iface.log where iface is the
selected interface for this session (for example,
packet_size-eth0.log).
The packet size breakdown can also be invoked straight from the command
line by specifying the -z iface parameter. The interface
parameter is required. For example, this command runs the facility on
interface eth0.
To exit, press X or Ctrl+X.
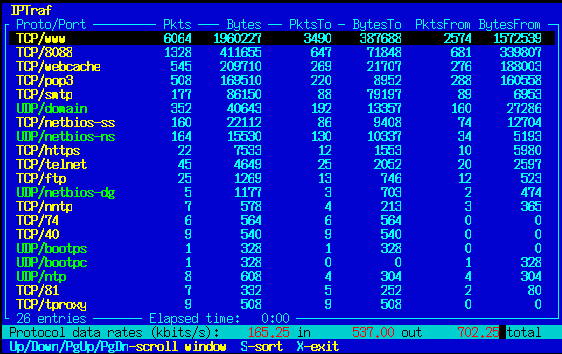
The statistics window indicates the protocol (TCP or UDP),
the port number, the total packets and bytes counted for
this particular protocol/port combination, the packets and
bytes destined for that protocol and port, and the packets
and bytes coming from that protocol and port.
Byte counts include the IP header and payload only. The data link
header is not included.
The protocol/port indicators are color-coded for easier
identification. TCP indicators are in yellow, UDP in
bright green (TCP is normal, UDP is bold white in non-color
mode).
Some network applications or protocols may use port numbers
higher than 1023. Examples of these include application
proxy servers (HTTP proxy servers typically use values like
8000, 8080, 8888, and the like), and IRC (IRC servers
commonly accept connections on ports 6660 to 6669). These
ports are by default not included in the counts. If you do
want to include a higher-numbered port in the statistics,
you can add them yourself from the Configure/Additional ports...
menu item. See the section below.
If logging is enabled, The statistics are also written to a log file
(the default name is tcp_udp_services-iface.log, where
iface is the selected interface (for example,
tcp_udp_services-eth0.log).
IPTraf computes the total, incoming, outgoing, and data rates of the
protocol currently indicated by the facility's highlight bar. The data rates
are indicated at the bottom of the screen. If logging is enabled, the
average data rates since the start of the facility are placed in the log file.
The Up and Down cursor keys move the highlight bar. Pressing X
or Ctrl+X exits and returns to the main menu (or the shell
if it was started from the command line).
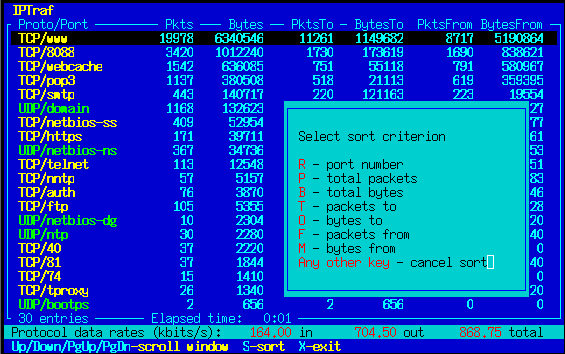
Sorting TCP/UDP Entries
Port numbers are sorted in ascending order (least first) but statistics are
sorted in descending order (largest counts first).
As with the IP traffic monitor, sorting is performed only with this
sequence. Automatic sorting is not performed so as not to affect
performance.
If you wish to start this facility from the command line,
you can use the -s option followed by an interface to
monitor. For example,
brings up this module for traffic on eth0. The interface must
be specified, or IPTraf will drop back to the shell.
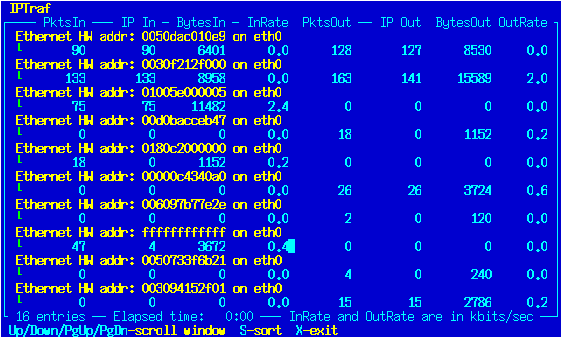
The entry above each line of statistics is the station's
LAN type (Ethernet, PLIP, or FDDI) and the hardware MAC address.
Each statistics line consists of the following information:
The byte counts include the data link header. The activity indicators can
be set to display kbits/s or kbytes/s with the Activity mode
configuration option.
This facility works only for Ethernet, PLIP, and FDDI frames. Loopback.
ISDN, and SLIP/PPP networks are not monitored here.
Copies of the statistics are written to a log file
at regular intervals if logging is enabled. The default log file name is
lan_statistics-n.log, where n is the instance
number of this facility (for example, if this is the first instance, the
generated default log file name is lan_statistics-1.log).
Sorting the LAN Station Monitor Entries
The window can be scrolled with the Up and Down cursor keys.
Press X or Q to return to the main menu (or the shell if this
facility was started with the -e command-line option).
Statistical Breakdowns
Statistical breakdowns contain two facilities that break down traffic counts
by either packet size or TCP/UDP port.
Statistical Breakdown: Packet Sizes
The packet size breakdown facility used to be incorporated into the
detailed interface statistics. It has since been moved to its own
facility. It is entered by selecting Statistical Breakdowns/By packet
size.
iptraf -z eth0
Statistical Breakdown: TCP and UDP Traffic Statistics
IPTraf also includes a facility that generates statistics on
TCP and UDP traffic. This facility displays counts of all
TCP and UDP packets with source or destination ports
numbered less than 1024. Ports 1 to 1023 are reserved for
the TCP/IP application protocols (well-known ports).
Pressing the S key brings up a window which allows you to select the field
by which the entries will be sorted. You can press R to sort by port, P to
sort by total packets, B to sort by total bytes, T to sort by incoming
packets (To packets), O to sort by incoming bytes (To bytes), F to
sort by outgoing packets (From packets) and M to sort by outgoing bytes (From
bytes). Pressing any other key cancels the sort.
iptraf -s eth0
LAN Station Statistics
The LAN station monitor (Ethernet station monitor on versions prior to
1.3.0) discovers MAC addresses and displays statistics on the number of
incoming, and outgoing packets. It also includes figures for incoming and
outgoing kilobits per second for each discovered station.
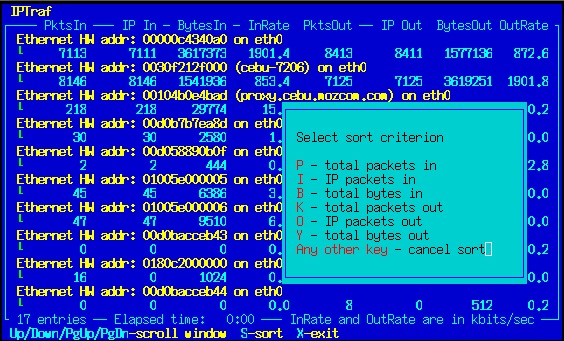
Press S to sort the entries. A box will pop up and display the
keys you can press to select the field by which the entries will be sorted.
Press P to sort by total incoming packets, I to sort by incoming IP packets,
B to sort by total incoming bytes, K to sort by total outgoing packets, O to
sort by outgoing IP packets, and Y to sort by total outgoing bytes.
Pressing any other key cancels the sort.
Display Filters
The Display Filters are used to control the information
displayed by the IP traffic monitor, general and detailed interface statistics,
and TCP/UDP statistical breakdown. You may want to view
statistics only on particular traffic, so you
must restrict the information displayed. The filters also
apply to logging activity.
Note The display filters affect the IP traffic monitor, the general and detailed interface statistics, and the TCP/UDP service monitor. The packet size breakdown and LAN station monitor are not affected. |
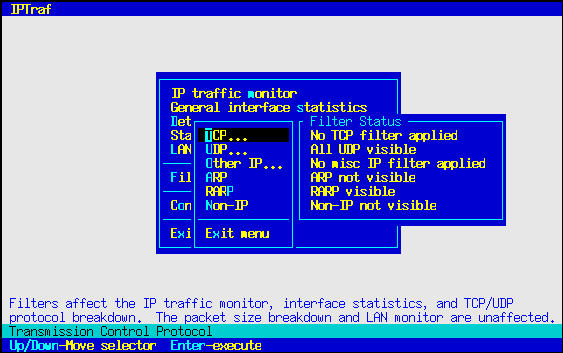
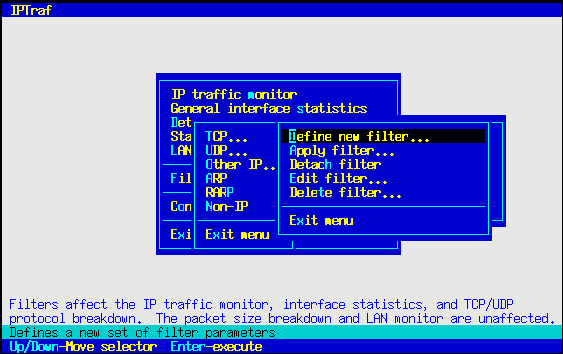
The IPTraf filter management system is accessible through the Filters... submenu.
Tip See the Linux Network Administrator's Guide if you need more information on IP addresses and subnet masking. |
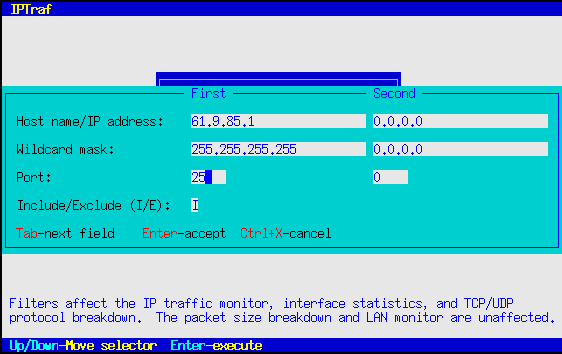
The Port fields should contain a port number of the service you may be interested in. Leave it at 0 to let the filter ignore it. You will most likely be interested in target ports rather than source ports (which are usually unpredictable anyway, perhaps with the exception of FTP data).
Fill out the second set of fields with the parameters of the opposite end of the connection. As previously mentioned, you may place either set of parameters in either set of fields. By default, the second set of parameters are preset to 0.0.0.0, 0.0.0.0, 0. Just Backspace or Delete over them and replace them if needed.
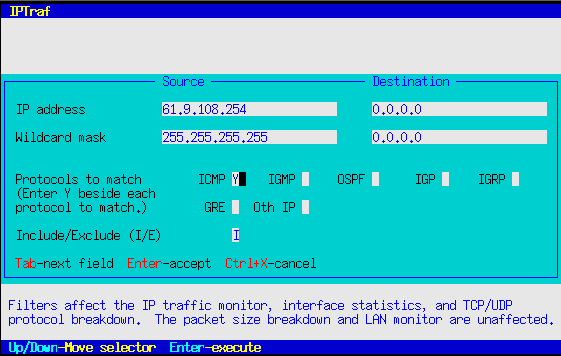
The last field is marked Include/Exclude. This field allows you to decide whether to include or exclude matching packets from the display. Setting this field to I causes the filter to display matching entries, while setting it to E causes the filter to suppress the display of matching entries. This field is set to I by default.
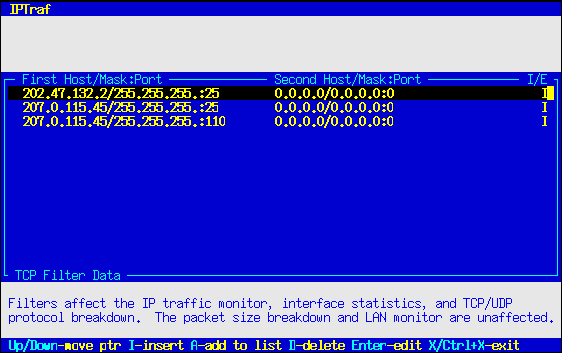
Press Enter to accept all parameters when done. The parameters will be accepted and you'll be presented with another blank form. You can enter as many sets of parameters as you wish. Press Ctrl+X at a blank form when done.
Examples
To see all traffic to/from host 202.47.132.1 from/to
207.0.115.44, regardless of TCP port
Host name/IP Address 202.47.132.2 207.0.115.44 Wildcard mask 255.255.255.255 255.255.255.255 Port 0 0 Include/Exclude ITo see all traffic from/to 207.0.115.44 to/from network 202.47.32.0
Host name/IP Address 207.0.115.44 202.47.132.0 Wildcard mask 255.255.255.255 255.255.255.0 Port 0 0 Include/Exclude ITo see all Web traffic, regardless of source or destination
Host name/IP Address 0.0.0.0 0.0.0.0 Wildcard mask 0.0.0.0 0.0.0.0 Port 80 0 Include/Exclude ITo see all mail (SMTP) traffic to a single host (202.47.132.2) from anywhere
Host name/IP Address 202.47.132.2 0.0.0.0 Wildcard mask 255.255.255.255 0.0.0.0 Port 25 0 Include/Exclude ITo see traffic to/from host sunsite.unc.edu from/to cebu.mozcom.com
Host name/IP Address sunsite.unc.edu cebu.mozcom.com Wildcard mask 255.255.255.255 255.255.255.255 Port 0 0 Include/Exclude ITo omit display of traffic to/from 140.66.5.x from/to anywhere
Host name/IP Address 140.66.5.x 0.0.0.0 Wildcard mask 255.255.255.0 0.0.0.0 Port 0 0 Include/Exclude EIn all cases, you could have interchanged the first and second sets of IP addresses, wildcard masks, and port values; they wouldn't have made any difference. That's why they're better referred to as "first" and "second" rather than "source" and "target".
You can enter as many parameters as you wish. All of them will be interpreted when the filter is processed.
Excluding Certain Sites from the Display
Filters follow an "implicit no-display" policy, that is, only
explicitly defined sites will be displayed, everything else is not.
This is similar to the access-list policy "whatever is not explicitly
permitted is denied". If you want to show all traffic to/from
everywhere, except certain places, you can specify the sites
you wish to exclude, mark them with E in the Include/Exclude field,
and define a general catch-all entry with source address 0.0.0.0,
mask 0.0.0.0, port 0, and destination 0.0.0.0, mask 0.0.0.0, port 0, tagged
with an I in the Include/Exclude field as the last entry.
For example:
To see all traffic except all SMTP, Web, and traffic from/to 207.0.115.44:
Host name/IP address 0.0.0.0 0.0.0.0 Wildcard mask 0.0.0.0 0.0.0.0 Port 25 0 Include/Exclude E Host name/IP address 0.0.0.0 0.0.0.0 Wildcard mask 0.0.0.0 0.0.0.0 Port 80 0 Include/Exclude E Host name/IP address 207.0.115.44 0.0.0.0 Wildcard mask 255.255.255.255 0.0.0.0 Port 0 0 Include/Exclude E Host name/IP address 0.0.0.0 0.0.0.0 Wildcard mask 0.0.0.0 0.0.0.0 Port 0 0 Include/Exclude I
Tip To omit all TCP from the display, define a filter with a single entry, with a source of 0.0.0.0 mask 0.0.0.0 port 0, and a destination of 0.0.0.0 mask 0.0.0.0 port 0, with the Include/Exclude field marked E (exclude). Then apply this filter. |
Note If you're editing the currently applied filter, you will need to re-apply the filter for the changes to take effect. |
Note Be aware that the filter process the rules in order. In other words, if a packet matches more than one rule, only the first matching rule is followed. |
Deleting a Defined Filter
Detaching a Filter
When you're done with the menu, just select the Exit menu
option.
Because UDP packets are also significantly high in volume,
you can also define a UDP filter the same way you do a TCP
filter. To work with UDP filters, select the Filters.../UDP... option.
You can opt to display all UDP packets, no UDP packets, and
define a custom UDP filter. Other than the first two
options, the others are almost identical to the custom TCP
filter options. Custom UDP filters can be defined, edited, and deleted as
TCP filters. See the section on TCP Filters
above.
Select Delete filter... from the menu to remove a filter from
the list. Just move the selection bar to the filter you want to
delete, and press Enter.
The Detach filter option deactivates the filter currently in
use. Selecting this option causes all TCP traffic to be passed to the
monitors.
UDP Filters
Tip To omit all non-TCP and non-UDP IP traffic from the display, define a filter with source and destination addresses 0.0.0.0, wildcard masks 0.0.0.0, without specifying Y to any of the protocols. Mark the Include/Exclude field with an I. |
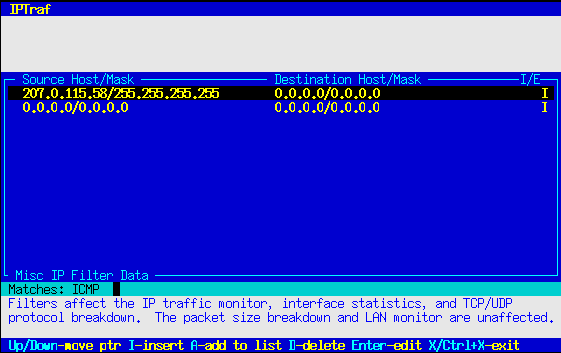
The filters can also be edited in much the same way as the TCP and UDP filters with the same keystrokes. After selecting the filter you want to edit, you will see the IP addresses/hostnames and masks of the filter rules. As you move the selection bar to select a rule, the bottom of the selection box displays the protocols that particular rule matches.
The Detach filter... item causes the filter to deactivate, and all protocols (other than TCP and UDP of course) will be displayed in the lower window.
As with the TCP and UDP filter editing dialogs, you can press Enter to edit the selected rule, I to insert at the selection bar's current position, A to add to the list of rules, and D to delete the currently pointed rule. You can move the rule selection bar with the Up and Down cursor keys.
The Delete filter... menu item allows you to delete an entire filter.
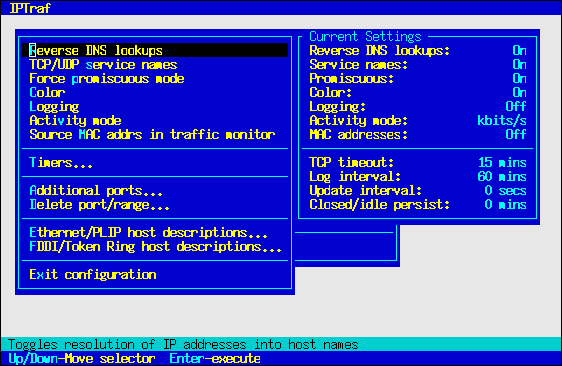
Note Reverse lookup and service name lookup take some time and may impact performance and increase the chances of dropped packets. Performance and results are best (albeit more cryptic) with both these settings off. |
Force promiscuous
If this option is enabled, your LAN interfaces will
capture all packets on your LAN. Using this option enables
you to see all TCP connections and packets passing your LAN
segment, even if they're not from or for your machine. When
this option is active in the statistics windows, the Activity
indicators will show a good estimate of the load on your
LAN segment.
When this option is disabled, you'll only receive information about packets coming from and entering your machine.
The setting of this option affects all LAN (both Ethernet and FDDI) interfaces on your machine, if you have more than one.
The interface's promiscuous flag is set only when a facility is started, and turned of when it exits. However, if promiscuous mode was already set when a facility was started, it remains set on exit.
If multiple instances of IPTraf are started, the promiscuous setting is restored only upon exit of the last facility.
Note Do not use other programs that change the interface's promiscuous flag at the same time you're using IPTraf. The programs can interfere with each other's expected operations. While IPTraf now tries to obtain the initial setting of any promiscuous flags for restoration upon exit, other programs may not be as well-behaved, and they may turn off the promiscuous flags while IPTraf is still monitoring. |
Color
Turn this on with color monitors. Turn it off with black-and-
white monitors or non-color terminals (like xterms).
Changes to this setting will take effect the next time the program is
started.
Color is on by default on consoles and color xterms, off on non-color terminals like xterms and VT100s.
Logging
When this option is active, IPTraf will log information to a
disk file, which can be examined or analyzed later. Starting with IPTraf
2.4.0, IPTraf prompts you for the name of the file to which to write the
logs. It will provide a default name, which you are free to accept or
change. The IP traffic monitor and LAN station monitor will generate a log
file name that is based on what instance they are (first, second, and so
on). The General Interface Statistics' default log file name is constant,
because it listens to all interfaces at once, and only one instance can run
at one time.
The other facilities generate a log file name based on the interface they're listening on
See the descriptions on the facilities above for the default log file names.
Press Enter to accept the log file name, or Ctrl+X to cancel. Canceling will turn logging off for that session.
The IP traffic monitor will write the following pieces of information to its log file:
Each log entry includes the date and time the entry was written. Logging is also affected by the defined filters.
Log files can grow very fast, so be prepared with plenty of free space and delete unneeded logs. Log write errors are not indicated.
Copies of the interface statistics, TCP/UDP statistics, packet size statistics, and LAN host statistics are also written to the log files at regular intervals. See Log Interval... below.
IPTraf closes and reopens the active log file when it receives a USR1 signal. This is useful in cases where a facility is run for long periods of time but the log files have to be cleared or moved.
To clear or move an active log file, rename it first. IPTraf will continue to write to the file despite the new name. Then use the UNIX kill command to send the running IPTraf process a USR1 signal. IPTraf will then close the log file and open another with the original name. You can then safely remove or delete the renamed file.
Do not delete an open log file. Doing so will only result in a file just as large but filled with null characters (ASCII code 0).
Logging comes disabled by default. The USR1 signal is caught only if logging is enabled, it is ignored otherwise.
Activity mode
Toggles activity indicators in the interface and LAN statistics facilities
between kilobits per second (kbits/s) or kilobytes per second (kbytes/s).
The default setting is kilobits per second.
Source MAC addrs in traffic monitor
When enabled, the IP traffic monitor retrieves the packets' source MAC
addresses if they came in on an Ethernet, FDDI, or PLIP interface. The
addresses appear in the lower window for non-TCP packets, while for TCP
connections, they can be viewed by pressing M.
No such information is displayed if the network interface doesn't use MAC addresses (such as PPP interfaces).
This can be used to determine the actual source of the packets on your local LAN.
The traffic monitor also logs the MAC addresses with this option enabled. The default setting is off.
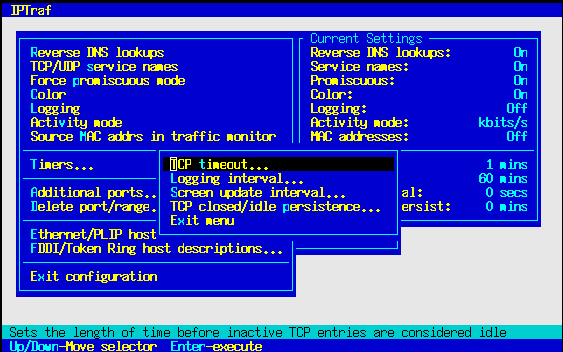
TCP Timeout
This figure determines the amount of time (in minutes) a
connection entry may remain idle before it becomes eligible
for replacement by a new connection. The default is 15
minutes. You may want to reduce this on an isolated (not
connected to the Internet) LAN or a LAN connected to the
Internet with high-speed links. Just enter the new value
and press Enter. You can press Ctrl+X to leave the current
value unchanged.
Log Interval
This figure determines the number of minutes between logging
of interface statistics, TCP/UDP figures, and LAN host
statistics. The default is 60 minutes. This figure is
meaningless if logging is disabled.
Screen Update Interval
This value determines the rate in seconds at which the screen is updated.
The default is 0, which means the screen is updated as fast
as possible, giving close-to-realtime reflection of network
activity. However, this high-speed update can cause incredible
amounts of traffic if IPTraf is run on a remote terminal (e.g.
a Telnet or Secure Shell session). You can set this to a higher
value, such as 1 or 2 seconds to slow down the updates.
This figure does not affect the rate of data capture. Only the screen refresh is affected. The figures are still updated as fast as possible, although the figure display will no longer be as close to realtime.
The default setting is 0, which shouldn't be a problem on the console. Set it to a slightly higher value on remote terminals or slow links. The setting affects all monitoring facilities.
Note
Updating the screen is one of the slowest operations in a program. Older
versions of IPTraf had a problem once network activity became very high.
Because each packet caused a screen update, IPTraf began spending more
time with the screen updates, causing a loss of packets once network
activity reached a certain point.
However, since many users like rapid counts on their screen, a compromise was incorporated. Even when the screen update interval is set to 0, there is still a 50ms delay between screen updates (except the LAN station monitor, which has a 100 ms delay). This is still visually fast, but provides more time to the packet capture routine. Higher delays may result in better accuracy of counts and activity. In any case, this setting only affects screen updates. Capture still proceeds as fast as possible. |
TCP closed/idle persistence
This parameter determines the interval (in minutes) at which the IP Traffic
Monitor clears from the TCP display window all closed, idle, and timed out
entries. Enter 0 to keep such entries on the screen indefinitely,
disappearing only when replaced by new connections.
Note The TCP timeout... option only tells IPTraf how long it should take before a connection should be considered idle and open to replacement by new connections. This does not determine how long it remains onscreen. The TCP closed/idle persistence... parameter flushes entries that have been idle for the number of minutes defined by the TCP timeout... option. |
Additional ports
Select this item to enter a port number to be included in
the TCP/UDP counts in the TCP/UDP service statistics main
menu item described above. By default, port numbers above
1023 are not monitored. If you do have a higher-numbered
port to monitor, enter it here.
You will see two fields. If you have only one port to enter, just fill up the first field. To specify a range, fill both fields, the first port in the first field, the last port in the second field.
You can select this option multiple times to add more values or ranges.
Delete port/range
Select this item to remove a higher-numbered port number or port range you
entered earlier with the Additional ports... option. A window will
come up containing the entered ports and ranges. Select the entry you
want delete and press Enter.
Note
The description file for Ethernet and PLIP is ethernet.desc,
while the FDDI and Token Ring mappings are stored in fddi.desc
in the IPTraf
working directory. These files are in colon-delimited text format.
Database engines or custom scripts can be told to
append data lines to those files. Each line follows this simple format:
For example 00201e457e:Cisco 3640 gateway Do not put colons, periods, or any invalid characters in the MAC address. |
Reminder IPTraf 2.x.x requires Linux kernel 2.2.x, with the Packet Socket option compiled in or installed as a module. IPTraf 2.x will return this error on a pre-2.2 kernel or on a 2.2 kernel without Packet Socket. |
Unable to obtain interface MTU
The detailed statistics facility was unable to obtain the maximum
transmission unit (MTU) for the selected interface. The facility will
abort.
Specified interface not supported
The interface specified with the -i, -d, -s,
-l or -z
command-line parameters is not supported by IPTraf.
Specified interface not active
The interface specified with the -i, -d, -s,
-l or -z
command-line parameters is supported, but not currently activated.
Fatal: memory allocation error
May occur if you have too little memory to allocate for windows, the
menu system, or dialog boxes. IPTraf tries to prevent further
allocations if memory runs out during a monitor. However, this could
also mean a bug if you're reasonably sure you're not out of memory.
An instructional message on bug reporting follows this message.
Technical note: This is actually a response to the segmentation fault error (SIGSEGV). |
This program can be run only by the system administrator
IPTraf normally does not allow anybody but uid 0 (root) to run it. This
measure is included for safety reasons. See the section on recompiling
the program below if you want to override this. This feature is built
in, and not part of the configuration
Your TERM variable is not set
The TERM (terminal type) environment variable must be set to a valid
terminal type so that the screen management routines can function
properly. Set it to the appropriate terminal type. Linux consoles
typically use a value called "linux".
Received TERM signal
Not related to the previous message. The TERM (terminate) signal is
normally used to
gracefully shut down a program. This message simply indicates that the
TERM signal was caught and IPTraf is attempting to shut down as gracefully
as possible.
Invalid option or missing parameter, use iptraf -h for help
The -i, -d, -s, -z or -l
options were specified but no interface was specified on the command line.
These parameters require a valid interface name (or all for
-i or -l).
This message also appears if an unknown option is passed to the iptraf command.
Warning: unable to tag this process
IPTraf normally tags itself when it runs to prevent multiple instances of
the statistical facilities from running. This message means the program was
unable to create the necessary tag file. This may be due to a bad or improper
installation. Try running the "make install" procedure.
Warning: unable to tag facility
IPTraf was unable to create the tag file for the facility you started.
The facility will still run, but other instances of IPTraf that may be
running simultaneously will allow the same facility to run. This may cause
both instances of the facility to malfunction. This could be due to a bad
disk or bad installation.
facility already running/listening on interface
The facility you tried to start is currently running on the indicated interface
in another IPTraf process on the machine. This restriction is placed to
prevent conflicts involving internal sockets or the log files.
General interface statistics already active in another process
Only one instance of the general interface statistics can run at a time.
Duplicate port/range entry
You entered a port number or range that was already added to the list of
additional ports to be monitored by the TCP/UDP service monitor
No custom ports
There are no ports or port ranges earlier added. There's nothing to
delete.
Can't start rvnamed; lookups will block
IPTraf cannot start the rvnamed daemon; probably due to a bad installation.
IPTraf will fall back to blocking lookups.
Can't spawn new process; lookups will block
IPTraf cannot start a new process. This may be due to memory shortage.
IPTraf will fall back to blocking lookups.
Fork error, IPTraf cannot run in background
IPTraf cannot start a new process, and can go into the background. This
may be due to memory shortage. IPTraf aborts.
No memory for new filter entry
IPTraf was unable to allocate memory for a new filter entry. Most likely
due to memory shortage.
Memory Low
This indicator appears if memory runs low due to a lot of entries in a
facility. Should critical functions fail (window creation, internal
allocation), the program could terminate with a segmentation violation.
Warning Any message or indicator about low memory means that your
system does not have enough memory to handle the entries. It is almost
certain that sooner or later, IPTraf or other applications will abort
due to the failure of important system calls or library functions.
Memory must be added right away.
|
IPC Error
This indicator appears if an error occurs receiving data from the rvnamed
program (IPC stands for Interprocess Communication). This indication should
not occur under normal circumstances. Report instances of this condition
and the circumstances under which it happens. You may also include data
from the rvnamed.log file.
Error opening terminal: terminal
The screen management routines cannot find the terminfo entry for your
terminal. IPTraf expects the terminfo database located in
/usr/share/terminfo. This error could occur when your terminfo
database is located somewhere else.
See the section above on controlling the terminfo search path.
This will end your IPTraf session
In interactive mode IPTraf asks you to confirm your exit command. Press
Enter to return to the shell or any other key to cancel your command and
return to the main menu.
Being a daemon, rvnamed does not send messages to the screen. It writes its messages to the file rvnamed.log in the IPTraf working directory.
Unable to open child communication socket
rvnamed was unable to open the communication endpoint for data reception
from the children it creates. This is highly unusual, and should it occur,
report the circumstances.
Unable to open client communication socket
rvnamed was unable to open the communication endpoint for data exchange with
the IPTraf program. This is highly unusual, and should it occur, report
the circumstances.
Error binding client communication socket
Error binding child communication socket
rvnamed was unable to assign a name to the indicated communication socket.
This may be due to a bad, full, or corrupted filesystem.
Fatal error: no memory for descriptor monitoring
rvnamed ran out of memory. IPTraf will resort to blocking, and may freeze.
Error on fork, returning IP address
rvnamed had a problem spawning a copy of itself to resolve the IP address.
rvnamed will simply return the IP address in its literal, dotted-decimal
notation. IPTraf will still function normally. This may be due to lack
of memory or a process limit hit.
Maximum child process limit reached
rvnamed has reached its maximum number of child processes. This is intended
as a "brake" to prevent too many rvnamed children from hogging your computer's
resources and possibly crashing it.
Unless IPTraf is monitoring an extremely busy network without filters, this shouldn't happen, at least, not that often. If you notice this message, try applying filters or check your DNS server. Many times, this can happen when the DNS server goes down for whatever reason, and you have rvnamed children taking too long to resolve.
The software and accompanying documentation are distributed under the terms of the GNU General Public License, Version 2 or any later version, as published by the Free Software Foundation, Inc. Permission is granted to distribute and/or modify the software and the documentation under the terms of the license.
The software and accompanying documentation are distributed "AS IS" WITHOUT ANY WARRANTY; without even the implied warranty of MERCHANTABILITY or FITNESS FOR ANY PARTICULAR PURPOSE. For more details, see the GNU General Public License, in the LICENSE file included in the distribution.
IPTraf uses header files that are part of the GNU C library and the Linux kernel distribution.
Additional structures were extracted from software copyrighted by the Regents of the University of California.
Linux is a registered trademark of Linus Torvalds.
Pentium is a registered trademark of Intel Corporation.