
Version 2.3.0
Permission is granted to reproduce and distribute this document with the included software under the terms of the GNU General Public License. This manual and the software that accompanies it come with absolutely no warranty, not even the implied warranties of merchantability or fitness for any particular purpose. See the included COPYING file for details.
This manual is the HTML version and can be viewed with any Web browser supporting HTML 3.2.
IPTraf can be used to monitor the load on an IP network,
the most used types of network services, the proceedings of
TCP connections, and others.
IPTraf is software-only, and utilizes the built-in raw
packet capture interface of the Linux kernel, allowing it to
be used with a wide range of Ethernet cards, supported FDDI adapters,
supported ISDN adapters, and any asynchronous SLIP/PPP interface. No
special hardware is required.
Basic knowledge of the important TCP/IP protocols (IP, TCP, UDP, ICMP,
etc.) is necessary for you to best understand the information generated by
the program.
The X Window system is not required.
Here are the installation instructions.
If you downloaded IPTraf from the Internet, follow these
steps to install the software:
If your tar doesn't support the z option, you can
separately decompress the tar.gz then extract the resulting
.tar archive.
This will decompress the sources into a directory called
iptraf-x.y.z.
x.y.z here should be the IPTraf version number you're
installing, like 2.2.0.
Change to the src directory. It already contains ready-to-run
distribution binaries for IPTraf and the accompanying rvnamed daemon.
This will copy the binaries to /usr/local/bin, and create
the /var/local/iptraf working directory and the
/var/log/iptraf log directory.
In both cases (downloaded and floppy), the installation will
store the program in /usr/local/bin with the binaries owned by
user root, readable, writable, and executable by the owner,
no permissions for the group, no permissions for all others.
(700 octal, or -rwx------).
In either case, perform the "make install" step. This not
only transfers the executable programs, but creates the
necessary directories if they do not yet exist. IPTraf will
not function properly without them.
Be sure /usr/local/bin is included in your environment's
PATH variable. You can edit the appropriate command in your login
customization file (.profile for the Bourne-type shells,
.cshrc for the C shells and its relatives).
There have been no file format changes since version 1.4. If you're
upgrading from a version prior to 1.4, do the "make upgrade" procedures
from each semi-major version in sequence (e.g. 1.2 -> 1.3 -> 1.4).
Entering the IPTraf command without any command-line parameters
brings up the program's main menu. From there, you can select
the facilities you want.
IPTraf determines and makes use of the maximum number of lines and columns
on the terminal.
You can also create a symbolic link named
/usr/share/terminfo to let
it point to your existing terminfo (assuming again your terminfo is in
/usr/lib/terminfo):
If this parameter is not specified, the facility runs until the exit
keystroke is pressed.
The -f parameter overrides the existing locks imposed by the IPTraf
process and by the various facilities, causing this instance to think it is
the first and that there are no other facilities running. Use this
parameter with great caution. A common use for this parameter is to recover
from abrupt or abnormal terminations which may leave stale locks still lying
around.
The -f parameter may be used together with the others.
While interactive commands in the IPTraf interface are not
case-sensitive, command-line options are.
A number standing alone with no suffix represents an exact count. A
number with a K following is a kilo (thousand) figure. An M, G, and T
suffix represents mega (million), giga (billion), and tera (trillion)
respectively. For example
These notations apply to both packet and byte counts.
See the descriptions of the individual facilities below for the names of
the log files. The logs are in plain text format and can be viewed with
any text pager or editor.
See the Screen update interval... configuration option under the
Configuration section of this manual.
Your system's network interfaces must be named according to the schemes
specified above.
There are two windows in the Traffic Monitor. Both of them
can be scrolled with the Up and Down cursor keys. Just
press W to move the Active indicator to the window you want
to control.
The TCP window is scrollable, and you can use the Up and Down arrow keys on
your keyboard to view more connections when the TCP window is marked Active.
Because this monitoring system relies solely on packet
information, it does not determine which endpoint initiated
the connection. In other words, it does not determine which
endpoint is the client, and which is the server. This is
necessary because it can operate in promiscuous mode, and as
such cannot determine the socket statuses for other machines
on the LAN.
That being the case, the system displays two entries for
each connection, one for each direction of the TCP
connection. To make it easier to determine the direction
pairs of each connection, a bracket is used to "join" both
together. This bracket appears at the leftmost part of each
entry.
Just because a host entry appears at the upper end of a connection bracket
doesn't mean it was the initiator of the connection.
Each entry in the window contains these fields:
Source address and port
The destination is the host:port at the other end of the bracket.
Packet count
Byte count
Packet Size
Window Size
Flag statuses
Two more data items can also be viewed, the packet size and
the advertised window size. When the TCP window is marked Active, pressing
M will replace the
packet and byte counts with the packet size and window size.
Press M again to view the packet counts and byte counts.
By default, only IP addresses are displayed, but if you have
access to a name server or host table, you may enable
reverse lookup for the IP addresses. Just enable reverse
lookup in the Configure menu.
If for some reason rvnamed cannot start (probably due to improper
installation or lack of memory), and you are on the Internet, and you
enable reverse lookup, your keyboard control can become very slow.
This is because the standard lookup functions do not return until they
have completed their tasks, and it can take several seconds for a name
resolution in the foreground to complete.
Entries not updated within a user-configurable amount of
time may get replaced with new connections. The default
time is 15 minutes. This is regardless of whether the
connection is closed or not. (Some unclosed connections may
be due to extremely slow links or crashes at either end of
the connection.) This figure can be changed at the Configure
menu.
Some early entries may have a > symbol in front of its
packet count. This means the connection was already
established when the monitor started. In other words, the
figures indicated do not reflect the counts since the start
of the TCP connection, but rather, since the start of the
traffic monitor. Eventually, these > entries will close (or
time out) and disappear. TCP entries without the > were
initiated after the traffic monitor started, and the counts
indicate the totals of the connection itself. Just consider
entries with > partial.
Some > entries may go idle if the traffic monitor was
started when these connections were already half-closed (FIN
sent by one host, but data still being sent by the other).
This is because the traffic monitor cannot determine if a
connection was already half-closed when it started. These
entries will eventually time out. (To minimize these
entries, an entry is not added by the monitor until a packet
with data or a SYN packet is received.)
Direction entries also become available for reuse if an ICMP
Destination Unreachable message is received for the
connection.
The lower part of the screen contains a summary line showing the
IP, TCP, UDP, ICMP, and non-IP byte counts since the start of the monitor.
The IP, TCP, UDP, and ICMP counts include only the IP datagram header and
data, not the data-link headers. The non-IP count includes the data-link
headers.
On forwarding (non-masquerading) machines packets and TCP connections simply
appear twice, one each for the incoming and outgoing interfaces.
On masquerading machines, packets and connections from the internal network to
the external network also appear twice, one for the internal and external
interface. Packets coming from the internal network will be indicated as
coming from the internal IP address that sourced them, and also as coming
from the IP address of the external interface on your masquerading machine.
In much the same way, packets coming in from the external network will look
like they're destined for the external network's IP address, and again as
destined for the final destination on the internal network.
Closed/Idle/Timed Out Connections
A TCP connection entry that closes, gets reset, or stays idle too long
normally get replaced with new connections. However, if these get too many,
active connections may become interspersed among closed, reset, or idle
entries.
IPTraf can be set to automatically remove all closed, reset, and idle
entries with the TCP closed/idle persistence... configuration option.
You can also press the F key to arbitrarily clear it at any time.
Sorting TCP Entries
The sort operation compares the larger values in each connection entry pair
and sorts the counts in descending order.
Over time, the entries will go out of order as counts proceed at varying
rates. Sorting is not done automatically so as not to degrade performance.
Unrecognized IP packets are indicated by their protocol numbers while
non-IP packets are indicated as Non-IP in the lower window.
Well, strictly speaking, ARP and RARP packets aren't IP
packets, since they are not encapsulated in an IP datagram.
They're just indicated because they are integral to proper
IP operation on LANs.
For all packets in the lower window, only the first IP fragment is
indicated (since that contains the header of the IP-encapsulated
protocol) but with no further information from the encapsulated protocol.
UDP packets are also displayed in address:port format. ICMP
entries also contain the ICMP message type. For easier
location, each type of protocol is color-coded (text console
only).
Some entries may be too long to completely fit in a screen line. You can
use the Left and Right cursor keys to vertically scroll the lower window
when it is marked Active.
Entry Details
ICMP: ICMP entries are displayed in this format:
ICMP type (subtype) (size bytes) from source
to destination on interface
where type could be any of the following:
The destination unreachable message also includes information
on the type of error encountered. Here are the destination
unreachable codes:
For more information on ICMP, see RFC 792.
OSPF: OSPF messages also include a little more information.
The format of an OSPF message in the window is:
OSPF type (a=area r=router) (size bytes)
from source to destination on interface
The type can be one of the following:
The entries in parentheses:
Many times, the destination addresses for OSPF packets are
class D multicast addresses in standard dotted decimal
notation or (if reverse lookup is enabled), hosts under the
MCAST.NET domain. Such multicast addresses are defined as follows:
See RFC 1247 for details on the OSPF protocol.
With logging enabled, IP traffic monitor information is written to the file
ip_traffic.log.
At any time, you can press X or Q to return to the main
menu (or back to the shell if the monitor was started with
iptraf -i).
The activity indicators can be toggled between kbits/s and kbytes/s with the
Activity mode configuration option.
The general statistics window will dynamically add new entries
as packets from newly-created interfaces (e.g. new PPP interfaces)
are intercepted. Long lists can be scrolled with the Up, Down,
PgUp, and PgDn keys.
Copies of the statistics are written to the log file
iface_stats_general.log at
regular intervals if logging is enabled. See the Logging
option below.
This facility can be started directly from the command line
with the -g option to the iptraf command.
You can press X or Q to return to the main menu.
All IP byte counts (IP, TCP, UDP, ICMP, other IP) include IP header data
and payload. The data link header is not included. The full frame length
(including data-link header) is included in the non-IP and Total byte
count.
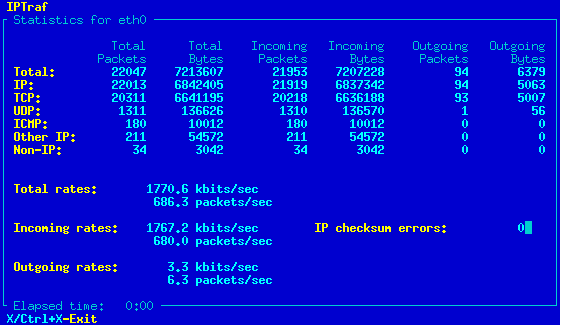
The upper portion of the screen contains the packet and
byte counts for all IP and non-IP packets intercepted on the
interface. The lower portion contains the total, incoming, and outgoing
interface data rates.
This facility also displays incoming and outgoing counts
and data rates. The packet size breakdown in versions prior to 2.0.0 has
been moved to its own facility under Statistical breakdowns/By
packet size.
An outgoing packet is one that exits your interface, regardless of whether
it originated from your machine or came from another machine and was
routed through yours. An incoming packet is one that enters your
interface, either addressed to you directly, broadcast, multicast, or
captured promiscuously.
The rate indicators can be set to display kbits/s or kbytes/s with the
Activity mode configuration option.
If you wish to start this facility directly from the command
line, you can specify the -d parameter and an interface to
monitor. For example,
The figure for the IP checksum error is a packet count only,
because the corrupted IP header cannot be relied upon to
give a correct IP packet length value.
The figures are logged at regular intervals if logging is
enabled.
Pressing X or Q takes you back to the main menu (if this facility
was started with the command-line option, X or Q drops you back
to the shell).
The packet size breakdown takes the interface's Maximum Transmission Unit
(MTU) size and divides it into 20 brackets, each bracket containing a
range of sizes. As a packet is captured, its size is determined and the
appropriate bracket is incremented.
This facility provides an idea as to the packet sizes passing over your
network, and can aid in network (re)design decisions.
If logging is enabled, copies of the statistics are written at regular
intervals to packet_size.log in the log directory.
The packet size breakdown can also be invoked straight from the command
line by specifying the -z iface parameter. The interface
parameter is required. For example, this command runs the facility on
interface eth0.
To exit, press X or Ctrl+X.
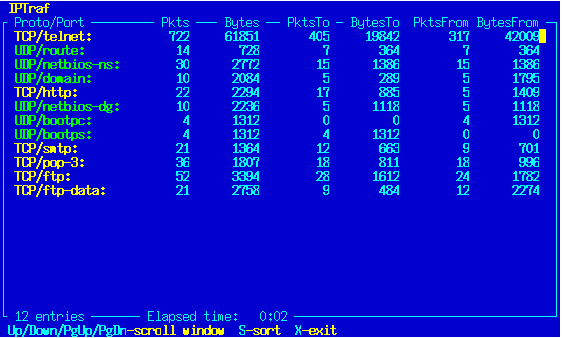
The statistics window indicates the protocol (TCP or UDP),
the port number, the total packets and bytes counted for
this particular protocol/port combination, the packets and
bytes destined for that protocol and port, and the packets
and bytes coming from that protocol and port.
Byte counts include the IP header and payload only. The data link
header is not included.
The protocol/port indicators are color-coded for easier
identification. TCP indicators are in yellow, UDP in
bright green (TCP is normal, UDP is bold white in non-color
mode).
Some network applications or protocols may use port numbers
higher than 1023. Examples of these include application
proxy servers (HTTP proxy servers typically use values like
8000, 8080, 8888, and the like), and IRC (IRC servers
commonly accept connections on ports 6660 to 6669). These
ports are by default not included in the counts. If you do
want to include a higher-numbered port in the statistics,
you can add them yourself from the Configure/Additional port...
menu item. See the section below.
The statistics are also written to the log file tcp_udp_services.log
if logging is enabled.
Sorting TCP/UDP Entries
Port numbers are sorted in ascending order (least first) but statistics are
sorted in descending order (largest counts first).
As with the IP Traffic Monitor, sorting is performed only with this
sequence. Automatic sorting is not performed so as not to affect
performance.
If you wish to start this facility from the command line,
you can use the -s option followed by an interface to
monitor. For example,
The Up and Down cursor keys scroll the window. Pressing X
or Ctrl+X exits and returns to the main menu (or the shell
if it was started from the command line).
The entry above each line of statistics is the station's
LAN type (Ethernet, PLIP, or FDDI) and the hardware MAC address.
Each statistics line consists of the following information:
The byte counts include the data link header. The activity indicators can
be set to display kbits/s or kbytes/s with the Activity mode
configuration option.
This facility works only for Ethernet, PLIP, and FDDI frames. Loopback.
ISDN, and SLIP/PPP networks are not monitored here.
Copies of the statistics are written to the log file
lan_statistics.log at regular
intervals if logging is enabled.
Sorting the LAN Station Monitor Entries
The window can be scrolled with the Up and Down cursor keys.
Press X or Q to return to the main menu (or the shell if this
facility was started with the -e command-line option).
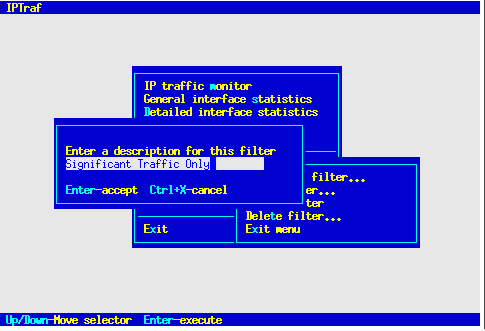
Defining a New Filter
Selecting this option displays a box asking you to enter a
short description of the filter you are going to define.
Just enter any text that clearly identifies the nature of
the filter.
Press Enter when you're done with that box. As an
alternative, you can also press Ctrl+X to cancel the
operation. Following that will be another dialog box asking
you for the source and target IP addresses, wildcard masks,
and service ports.
You can enter addresses of individual hosts, networks, or a
catch-all address. The nature of the address will be
determined by the wildcard mask.
You'll notice two sets of fields. You fill these out with
the information about your source and targets. Strictly
speaking, because packets alone don't provide information
about which side initiated the connection (except for SYN
packets), you may think of these as "endpoint" fields rather
than as strict source/target fields. That means, you can enter
information about the "from" side in the first set of
fields, and the "to" side in the second set, or vice versa.
It doesn't matter, since TCP is full duplex. (Also
important, since the Traffic Monitor displays information
about both sides of the connection).
Fill out the IP address of the hosts or networks in the
first field marked Host name/IP Address. Enter it in standard dotted-
decimal notation. When done, press Tab to move to the
Wildcard mask field. The wildcard mask is similar but not
exactly identical to the standard IP subnet masks. The
wildcard mask is used to determine which bits to ignore when
processing the filter. In most cases, it will work very
closely like a subnet mask. Place ones (1) under the bits
you want the filter to recognize, and keep zeros (0) under
the bits you want the filter to ignore. For example:
The wildcard mask also does not have to end on a byte
boundary; you may mask right into a byte itself. For
example, 255.255.255.224 masks 27 bits (224 is 11100000 in
binary).
Leaving the wildcard mask fields blank or storing invalid data in them
causes the filter to recognize the entries as 255.255.255.255.
IPTraf also accepts host names in place of the IP addresses. IPTraf will
resolve the host name when the filter is loaded. When the filter is
interpreted, the wildcard mask will also be applied. This can be useful
in cases where a single host name may resolve to several IP addresses.
The Port field should contain a port number of the service
you may be interested in. Leave it at 0 to let the filter
ignore it. You will most likely be interested in target
ports rather than source ports (which are usually
unpredictable anyway, perhaps with the exception of FTP
data).
Fill out the second set of fields with the parameters of the
opposite end of the connection. As previously mentioned,
you may place either set of parameters in either set. By
default, the second set of parameters are preset to
0.0.0.0, 0.0.0.0, 0. Just Backspace or Delete over them and
replace them if needed.
The last field is marked Include/Exclude. This field allows you
to decide whether to include or exclude this entry from the display.
Setting this field to I causes the filter to display matching
entries, while setting it to E causes the filter to supress the
display of matching entries. This field is set to I by default.
Press Enter to accept all parameters when done. The
parameters will be accepted and you'll be presented with
another blank form. You can enter as many sets of paramters as you
wish. Press Ctrl+X at a blank form when done.
Examples
You can enter as many parameters as you wish. All of them
will be interpreted when the filter is processed.
Excepting Certain Sites from the Display
For example:
To see all traffic except all SMTP, Web, and traffic from/to 207.0.115.44:
Applying a Filter
The applied filter stays in effect over exits and restarts of the
IPTraf program until it is detached.
Editing a Defined Filter
Edit the description if you wish. Pressing Ctrl+X at this point will abort
the operation, and the filter will remain unmodified. Press Enter to accept
any changes to the filter description.
After pressing Enter, you will see the filter's rules. To edit an existing
filter rule, move the pointer to the desired entry and press Enter. A
prefilled dialog box will appear. Edit its contents as desired. Press
Enter to accept the changes or Ctrl+X to discard.
You can add a new filter rule by pressing I to insert at the current pointer
position. When you press I, you will be presented with a dialog box asking
you to enter the new rule data. Pressing A results in a similar operation,
except the rule will be appended as the last entry in the rule list.
Pressing D deletes the currently pointed entry.
Press X or Ctrl+X to end the edit and save the changes.
Deleting a Defined Filter
Detaching a Filter
When you're done with the menu, just select the Exit menu
option.
Because UDP packets are also significantly high in volume,
you can also define a UDP filter the same way you do a TCP
filter. To work with UDP filters, select the UDP... option.
You can opt to display all UDP packets, no UDP packets, and
define a custom UDP filter. Other than the first two
options, the others are almost identical to the custom TCP
filter options. Custom UDP filters can be defined, edited, and deleted as
TCP filters. See the section on TCP Filters
above.
If you applied a custom UDP filter, or set IPTraf to display
all UDP packets, UDP will be included in the list of visible
protocols.
The Non-IP filter option toggles the display and logging of all
non-IP packets, excepting ARP and RARP, which are toggled separately.
The filters for non-TCP protocols are saved and automatically
reapplied whenever IPTraf is restarted after an exit.
Reverse Lookup
This option is off by default.
TCP/UDP service Names
This setting is off by default.
Force promiscuous
When this option is disabled, you'll only receive
information about packets coming from and entering your
machine.
The setting of this option affects all LAN (both Ethernet and FDDI)
interfaces on your machine, if you have more than one.
The interface's promiscuous flag is set only when a facility is started,
and turned of when it exits. However, if promiscuous mode was already set
when a facility was started, it remains set on exit.
If multiple instances of IPTraf are started, the promiscuous setting is
restored only upon exit of the last facility.
Color
Color is on by default on consoles, off on non-color terminal
types like xterms and VT100s.
Logging
The traffic monitor will write the following pieces of
information to its log file:
Each log entry includes the date and time the entry was
written. Logging is also affected by the defined filters.
Log files can grow very fast, so be prepared with plenty of
free space and delete unneeded logs. Log write errors are
not indicated.
Copies of the interface statistics, TCP/UDP statistics, packet size
statistics, and LAN host statistics are also written to the log
files at regular intervals. See Log Interval... below.
IPTraf closes and reopens the active log file when it receives a USR1
signal. This is useful in cases where a facility is run for long periods
of time but the log files have to be cleared or moved.
To clear or move an active log file, rename it first. IPTraf will
continue to write to the file despite the new name. Then use the UNIX
kill command to send the running IPTraf process a USR1 signal.
IPTraf will then close the log file and open another with the original
name. You can then safely remove or delete the renamed file.
Do not delete an open log file. Doing so will only result in a file just
as large but filled with null characters (ASCII code 0).
Logging comes disabled by default. The USR1 signal is caught only if
logging is enabled, it is ignored otherwise.
Activity mode
The default setting is kilobits per second.
TCP Timeout
This figure determines the amount of time (in minutes) a
connection entry may remain idle before it becomes eligible
for replacement by a new connection. The default is 15
minutes. You may want to reduce this on an isolated (not
connected to the Internet) LAN or a LAN connected to the
Internet with high-speed links. Just enter the new value
and press Enter. You can press Ctrl+X to leave the current
value unchanged.
Log Interval
Screen Update Interval
This figure does not affect the rate of data capture. Only the
screen refresh is affected. The figures are still updated as
fast as possible, although the figure display will no longer be as
close to realtime.
The default setting is 0, which shouldn't be a problem on the
console. Set it to a slightly higher value on remote terminals or
slow links. The setting affects all monitoring facilities.
However, since many users like rapid counts on their screen, a compromise was
incorporated. Even when the screen update interval is set to 0, there is still
a 50ms delay between screen updates (except the LAN station monitor, which
has a 100 ms delay). This is still visually fast, but provides more
time to the packet capture routine. Higher delays may result in better
accuracy of counts and activity.
In any case, this setting only affects screen updates. Capture still
proceeds as fast as possible.
TCP closed/idle persistence
Additional port
You will see two fields. If you have only one port to enter,
just fill up the first field. To specify a range, fill both fields, the
first port in the first field, the last port in the second field.
You can select this option multiple times to add more values or ranges.
Delete port/range
Selecting the
Ethernet/PLIP host descriptions or FDDI host descriptions options
brings up a submenu asking you to add, edit, or delete descriptions.
To add a new description, select the Add description... option. A
dialog box will appear, asking you for the MAC address and an
appropriate description. Type in the address in hexadecimal notation
with no punctuation of any kind. The dialog box is case-insensitive for
the address; the alphabetical digits A to F will be stored in lowercase.
Use the Tab key to move between fields and Enter to accept. Press Ctrl+X
to discard this dialog and return to the main menu.
The description may be anything: the IP address, a fully-qualified domain
name, or a description of your liking as long as the field can hold.
Enter as many descriptions as you need. Press Ctrl+X at a blank dialog
after you have entered the last entry
These descriptions will be displayed alongside the MAC addresses in
the LAN station monitor, together with the type of frame (Ethernet, PLIP,
or FDDI).
An existing address or description may be edited by selecting the
Edit description... option from the submenu. A panel will appear
with a list of existing address descriptions. Select the one you wish
to edit and press Enter. A dialog box identical to that when you add
a description will appear with prefilled fields. Just backspace over and
edit the fields. Press Enter to accept or Ctrl+X to cancel.
Selecting the Delete description... submenu item brings up the
selection panel. Select the description you want to delete and press Enter.
You can also press Ctrl+X to cancel the operation.
00201e457e:Cisco 3640 gateway
Do not put colons, periods, or any invalid characters in the MAC address.
Before starting a statistical facility in the background, configure IPTraf
in the usual way (set filters, add TCP/UDP ports, etc).
Once that's done, exit all instances of IPTraf on the system, then invoke
IPTraf from the command line with the parameter to start the facility you
want, the timeout (-t) parameter if you wish, and the
-B parameter to actually daemonize the program. For example, to
run the IP Traffic Monitor in the background for all interfaces, issue the
command
To run the Detailed Interface Statistics on interface eth0 for 5
minutes in the background:
If the timeout parameter is not specified, the facility will run until the
process recieves a USR2 signal. To stop a facility in the background, do
a
Since IPTraf cannot send error messages to the terminal, all messages are
written to the file daemon.log in the IPTraf logging directory.
The -B automatically enables logging regardless of its
configured setting. The parameter is ignored if not used with one of the
parameters to start a facility from the command line.
Unable to read config file
Unable to write config file
Error loading filter list file
Error writing filter list file
Unable to read filter file
Error opening filter file
Unable to write TCP/UDP filter record
Cannot create TCP/UDP filter record file
Unable to create TCP/UDP filter file
Unable to save TCP/UDP filter name
Unable to save filter changes
IPTraf cannot save the changes you made to the filter. You probably have a
disk error.
Unable to retrieve saved TCP/UDP filter
Unable to write non-TCP filters
Unable to save interface flags
Unable to retrieve saved interface flags
protocol data file in use; try again later
Unable to resolve hostname
The filter parameters will not be used.
Unable to open host description file
Unable to write host description
No descriptions
Cannot open log file
Unable to obtain interface list
Unable to obtain interface parameters for interface
Promisc change failed for interface
Unable to open raw socket for flag change
Unable to open socket for MTU determination
Unable to open raw socket
Unable to obtain interface MTU
Specified interface not supported
Specified interface not active
Fatal: memory allocation error
This program can be run only by the system administrator
Your TERM variable is not set
Received TERM signal
Invalid option or missing parameter, use iptraf -h for help
This message also appears if an unknown option is passed to the iptraf
command.
Warning: unable to tag this process
Warning: unable to tag facility
facility already active in another process
Duplicate port/range entry
No custom ports
Can't start rvnamed; lookups will block
Can't spawn new process; lookups will block
Fork error, IPTraf cannot run in background
No memory for new filter entry
Memory Low
IPC Error
Error opening terminal: terminal
See the section above on controlling the terminfo search path.
Being a daemon, rvnamed does not send messages to the screen. It writes
its messages to the file rvnamed.log in the IPTraf working directory.
Unable to open child communication socket
Unable to open client communication socket
Error binding client communication socket
Fatal error: no memory for descriptor monitoring
Error on fork, returning IP address
The distribution executable file is dynamically-linked ELF.
It uses the shared C library, but the ncurses and panels
libraries are linked in. With most systems, this program
should work immediately after installation.
If you have the appropriate libraries and facilities, you
can recompile the program to use the shared versions of the
ncurses and panels libraries.
Recompiling requires:
The dirs.h header file also contains the default locations
for the working directory and the names and locations of the
configuration and log files. You do not need to change
these, but you may do so if you'd rather place these files
somewhere else.
Read the comments in the Makefile and dirs.h files for information on the
various directives.
When compilation is complete, enter
The new kernel's raw packet capture facility has been extended since the
last stable kernel release, and IPTraf now takes advantage of the new
functionality, enabling it to count packets on a directional
(incoming/outgoing) basis.
The rvnamed daemon communicates with IPTraf with the UNIX
domain socket mechanism. Being a background daemon, it may present
a possible security issue if it turns out to be broken. Please
report any discovered problems immediately.
IPTraf will use the maximum number of available lines and columns in the
terminal.
There is also a little concern regarding the Backspace key.
Apparently the backspace key mapping (KEY_BACKSPACE) is
considered unreliable, and is marked as such in ncurses
versions as late as 1.9.9e, although tests on this version
already worked. Tests for 1.9.4 failed; pressing the
Backspace key yielded ^?. The Delete key works with no problem
though. If you want the program to not recognize the
Backspace key, you can enable the -DDISABLEBS directive in
the Makefile.
Earlier versions of ncurses also did not properly define the behavior
of overlapping windows. This has been fixed in 1.9.9e.
With Ethernet and FDDI, IPTraf can receive packets in promiscuous mode
(i.e. all packets on the LAN, regardless of their
destination). Promiscuous mode is pointless on SLIP/PPP
interfaces, since these things are point-to-point links.
IPTraf imposes no additional load on the network, except for
DNS traffic if reverse name lookup is enabled. (Some setups use RPC calls
to obtain service name information. This could also add UDP traffic to
the network.)
The software and accompanying documentation are distributed
under the terms of the GNU General Public License, Version 2
or any later version, as published by the Free Software
Foundation, Inc. Permission is granted to distribute and/or
modify the software and the documentation under the terms of
the license.
The software and accompanying documentation are distributed WITHOUT ANY
WARRANTY; without even the implied warranty of MERCHANTABILITY
or FITNESS FOR ANY PARTICULAR PURPOSE. For more details, see
the GNU General Public License, in the COPYING file included
in the distribution.
IPTraf uses header files that are part of the GNU C library and the Linux
kernel distribution.
Additional structures were extracted from software
copyrighted by the Regents of the University of California.
Linux is a registered trademark of Linus Torvalds
Pentium is a registered trademark of Intel Corporation.
For Additional Information
See the included README file for summarized and late-breaking information.
The CHANGES file contains a record of the changes made to the software since
1.0.0. README.rvnamed contains information on the rvnamed reverse
resolution program. See the other README files for support and
development information.
Document Conventions
Introduction
IPTraf is a network monitoring utility for IP networks. It
intercepts packets on the network and gives out various pieces
of information about the current IP traffic over it.
Information returned by IPTraf include:
Installation
IPTraf is most readily available on the Internet, but some
may receive it on a diskette. Here are the instructions for
both types of distributions.
System Requirements
The supplied IPTraf precompiled program requires the following to run:
Note Other architectures (SPARC, Alpha, M68K, PowerPC, etc) may
also be used but no tests have been performed on them.
Distribution-specific packages may be available, check with the package
maintainer for details
Note If you're running a custom-built kernel, make sure you compile
in or install as a module the Packet Socket kernel option, or IPTraf
(and others like it) will fail.
Installing the Downloaded Package
IPTraf can be downloaded from the Internet. The
downloadable package is in a compressed (gzip) tar archive.
To extract the files from the archive, you need these
utilities:
tar zxvf iptraf-x.y.z.tar.gz
gunzip iptraf-x.y.z.tar.gz
tar xvf iptraf-x.y.z.tar
make install
while you are logged in as "root". This will install the distribution
binary in the /usr/local/bin directory. The necessary working
directory /var/local/iptraf will also be created.
Installing the Floppy Distribution
If you received IPTraf on a diskette, the sources are
already decompressed. The diskette is in Second Extended
filesystem format. Perform the following steps to install
the software.
mount -t ext2 /dev/fd0 /mnt
This assumes your floppy is in /dev/fd0. You can use any
empty directory in place of /mnt. With most Linux
distributions, this will work.
make install
while logged in as root.
        umount /mnt

    (That's umount, not unmount.)
You can then eject the diskette. Store it in a safe
place.
Note You must be logged in as root to perform the "make install"
step to allow the proper directories to be written to or created.
Upgrading from Earlier Versions
If you're running IPTraf 2.0.x or earlier, and you're using TCP/UDP
filters, do a "make upgrade" procedure. Versions 1.4.x and 2.0.x
erroneously placed the filter data files in a wrong directory due to a
filename parsing bug.
Starting IPTraf
After installation, you can start the program by simply
entering
iptraf
at the shell prompt. You will see a copyright notice, with
an instruction to press any key to get started. Just press
any character key, and you will be immediately taken to the
main menu. All major functions of the program are found
here.
Note IPTraf does not yet have a SIGWINCH handler, and does not adjust
itself when an xterm other X terminal is resized.
Technical note
IPTraf needs to refer to the terminfo database in
/usr/share/terminfo. If the supplied executable program fails
with "Error opening terminal", your terminfo database may be located
somewhere
else. You can control the terminfo search path by using the TERMINFO
environment variable. For example, if you're using the sh or bash shell,
and your terminfo database is in /usr/lib/terminfo (typical for
Slackware
distributions), you can use the commands:
TERMINFO=/usr/lib/terminfo
You can place these commands in your ~/.profile or the systemwide
/etc/profile startup files.
export TERMINFO
ln -s /usr/lib/terminfo /usr/share/terminfo
Or you can recompile your program to use your existing ncurses library
installation. If you do this, make sure you have ncurses 1.9.9e or later.
Command-line Options
The following command-line parameters can also be passed to the IPTraf
command:
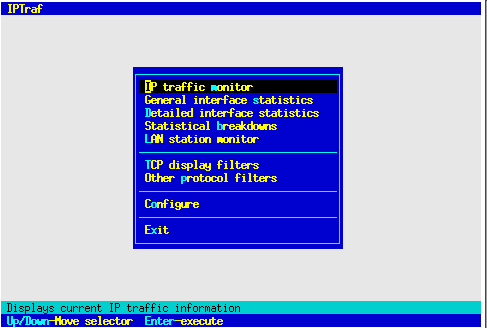
Using the Menus
Use the Up and Down arrow keys on your keyboard to move the selection bar.
Press Enter to execute the selected item.
Alternatively, you can also directly press the highlighted letter of the
item you want. This will immediately execute the option.
Using IPTraf
General Information
The following sections document the various statistics facilities. The
default behavior is to return counts in as close to real time as possible,
although this may be adjusted at the Configuration menu.
Number Display Notations
Initially IPTraf returns counts in bytes and packets. However, as they
grow larger, IPTraf begins displaying them in higher denominations.
1024067		- exactly 1024067
1024K		- approximately 1024000
1024M		- approximately 1024000000
1024G		- approximately 1024000000000
1024T		- approximately 1024000000000000
Logging
The statistical facilities can log their counts and information to log files.
As of version 1.3, log files are by default stored in the directory
/var/log/iptraf. Each facility logs its information to its own log file.
See the Logging option under Configuration
below.
Screen Update Delays
Older versions of IPTraf updated the screen as soon as a packet was received.
However, screen updates are one of the slowest operations the program
performs. Since version 1.3, a configuration option has been available
to
control screen update speed.
Supported Network Interfaces
IPTraf currently supports the following network interface types and names.
IP Traffic Monitor
Executing the first menu item or specifying -i to the iptraf
command takes you to the IP Traffic Monitor. The Traffic
Monitor is a real-time monitoring system that intercepts all
packets on all detected network interfaces. The monitor
decodes the IP information on all IP packets and displays the
appropriate information about it, most notably the source and
destination addresses. In addition to that, it also determines
the encapsulated protocol within the IP packet, and displays
some important information about that as well.
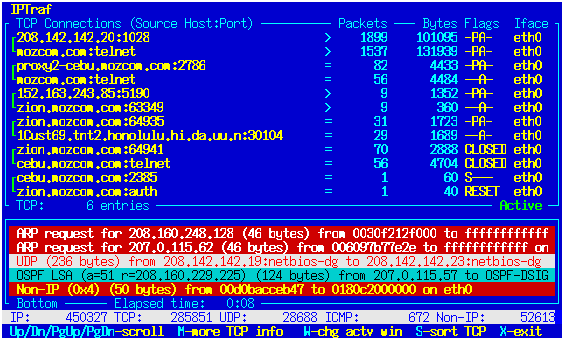
Upper Window
The upper window of the Traffic Monitor displays the
currently detected TCP connections. Information about TCP
packets are displayed here. The window contains these
pieces of information:
Note Previous versions of IPTraf showed both the source and
destination addresses on each line. IPTraf 2 shows only the source
host:port combination to save on screen real estate. TCP connection
endpoints are still indicated with the green brackets along the left edge of
the screen.
The source address and port indicator is in address:port format.
This indicates the source machine and TCP port on that machine
from which this data is coming.
The number of packets received for this direction of the
TCP connection
The number of bytes received for this direction of the TCP
connection. These bytes include total IP and TCP header information,
in addition to the actual data. Data link header (e.g. Ethernet and FDDI)
data are not included.
The size of the most recently received packet. This item is visible
if you press M for more TCP information. This is the size of the IP
datagram only, not including the data link header.
The advertised window size of the most recently received packet. This
item is visible if you press M for more TCP information.
The flags of the most recently received packet.
The rvnamed Process
The IP Traffic Monitor starts a daemon called rvnamed to help
speed up reverse lookups without sacrificing too much
keyboard control and accuracy of the counts. While reverse
lookup is being conducted in the background, IP addresses
will be used until the resolution is complete.
Tip
If you notice unusual SYN activity (too many initial (S---) but
frozen SYN entries, or rapidly increasing initial
SYN packets for a single connection), you may be under a SYN
flooding attack. Apply appropriate measures, or the
targeted machine may begin denying network services.
Technical note: IP Forwarding and Masquerading
Previous versions of IPTraf issued a warning if the kernel had IP
Masquerading enabled due to the way the kernel masqueraded and translated
the IP addresses. The new kernels no longer do it as before and IPTraf now
gives output properly on masquerading machines. The -q parameter
is no longer required to suppress the warning screen.
Note The TCP timeout... option only tells IPTraf how long it
should take before a connection should be considered idle and open to
replacement by new connections. This does not determine how long it remains
onscreen. The TCP closed/idle persistence... parameter flushes
entries that have been idle for the number of minutes defined by the
TCP timeout... option.
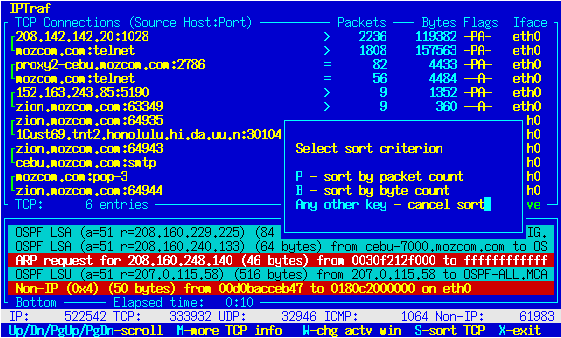
The TCP connection entries can be sorted by pressing the S key, then by
selecting a sort criterion. Pressing S will display a box showing the
available sort criteria. Press P to sort by packet count, B to sort by byte
count. Pressing any other key will cancel the sort.
Lower Window
The lower window displays information about the other types
of traffic on your network. The following protocols are
detected:
Note
The source and destination addresses for ARP and RARP entries
are MAC addresses.
UDP             Red on White
ICMP		Yellow on Blue
OSPF		Black on Cyan
IGRP		Bright white on Cyan
IGP		Red on Cyan
IGMP		Bright green on Blue
GRE		Blue on White
ARP		Bright white on Red
RARP		Bright white on Red
Other IP        Yellow on Red
Non-IP		Yellow on Red
The lower window can hold up to 512 entries. You can scroll
the lower window by using the W key to move the Active
indicator to it, and by using the Up and Down cursor keys.
The lower window automatically scrolls every time a new
entry is added, and either the first entry or last entry is
visible. Upon reaching 512 entries, old entries are thrown out
as new entries are added.
In general, the entries in the lower window indicate the
protocol, the IP datagram size (full frame size for non-IP, including ARP
and RARP), the source address, the destination address,
and the network interface the packet was detected on. However, some
protocols have a little more information.
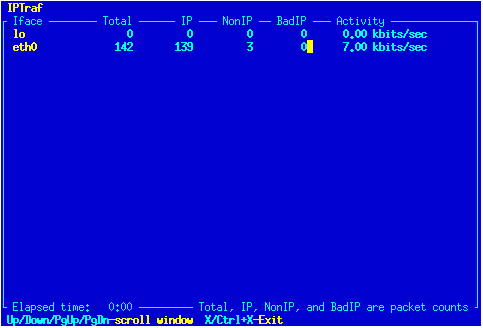
General Interface Statistics
The second menu option displays a list of attached network
interfaces, and some general packet counts. Specifically,
it displays counts of IP, non-IP, and bad IP packets
(packets with IP checksum errors). It also includes an
activity indicator, which shows the number of kilobits and
packets the interface sees per second. All figures are for
incoming and outgoing packets. (Again, considering
promiscuous mode for LAN interfaces, which simply causes the machine
to intercept all packets). This is useful for general monitoring
of all attached interfaces. If byte counts and additional information
are needed for a specific interface, the Detailed interface
statistics option is also available.
Detailed Interface Statistics
The third menu option displays packet statistics for any
selected interface. It provides basically the same
information as the General interface statistics option, with
additional information. This option provides the following
information:
Note
Buffering and some other factors may affect the data rates, notably
the outgoing rate, causing it to reflect a higher figure than the actual
rate at which the interface is sending.
iptraf -d eth0
starts the statistics for eth0. The interface must be
specified, or IPTraf will not start the facility.
Note
In both the general and detailed statistics screens, as well
as in the IP Traffic Monitor, the packet counts are for
actual network packets (layer 2), not the logical IP packets
(layer 3) that may be reconstructed after fragmentation.
That means, if a packet was fragmented into four pieces, and
these four fragments pass over your interface, the packet
counts will indicate four separate packets.
Statistical Breakdowns
Statistical breakdowns contain two facilities that break down traffic counts
by either packet size or TCP/UDP port.
Statistical Breakdown: Packet Sizes
The packet size breakdown facility used to be incorporated into the
detailed interface statistics. It has since been moved to its own
facility. It is entered by selecting Statistical Breakdowns/By packet
size.
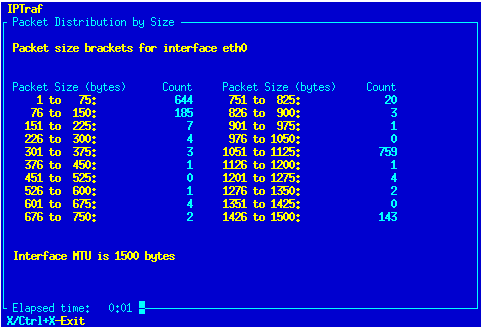
iptraf -z eth0
Statistical Breakdown: TCP and UDP Traffic Statistics
IPTraf also includes a facility that generates statistics on
TCP and UDP traffic. This facility displays counts of all
TCP and UDP packets with source or destination ports
numbered less than 1024. Ports 1 to 1023 are reserved for
the TCP/IP application protocols (well-known ports).
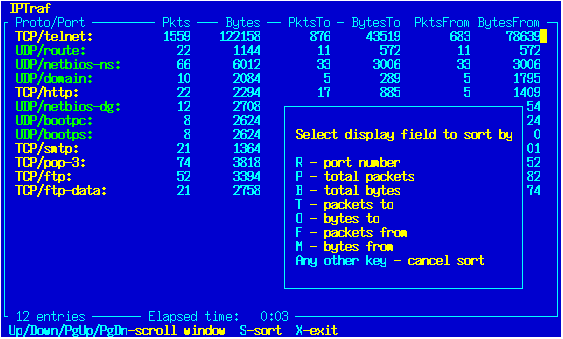
Pressing the S key brings up a window which allows you to select the field
by which the entries will be sorted. You can press R to sort by port, P to
sort by total packets, B to sort by total bytes, T to sort by incoming
packets (To packets), O to sort by incoming bytes (To bytes), F to
sort by outgoing packets (From packets) and M to sort by outgoing bytes (Fom
bytes). Pressing any other key cancels the sort.
iptraf -s eth0
brings up this module for traffic on eth0. The interface must
be specified, or IPTraf will drop back to the shell.
LAN Station Statistics
The LAN Station Monitor (Ethernet Station Monitor on versions prior to
1.3.0) discovers MAC addresses and displays statistics on the number of
incoming, and outgoing packets. It also includes figures for incoming and
outgoing kilobits per second for each discovered station.
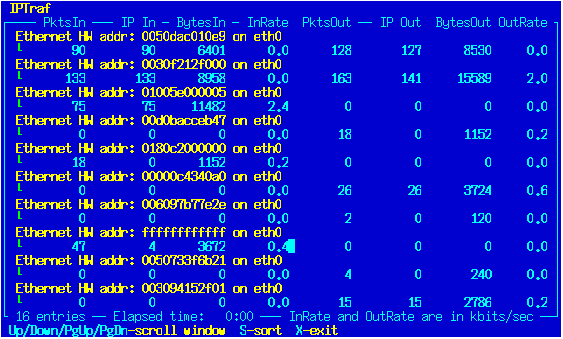
Press S to sort the entries. A box will pop up and display the
keys you can press to select the field by which the entries will be sorted.
Press P to sort by total incoming packets, I to sort by incoming IP packets,
B to sort by total incoming bytes, K to sort by total outgoing packets, O to
sort by outgoing IP packets, and Y to sort by total outgoing bytes.
Pressing any other key cancels the sort.

Display Filters
The Display Filters are used to control the information
displayed by the IP Traffic Monitor. In many cases, the
Traffic Monitor fills up very rapidly with information, most
of which you may not need. You may want to use such a
display just to get a general idea of the network traffic,
but if you're interested only in particular traffic, you
must restrict the information displayed. The filters also
apply to logging activity.
TCP Filters
The TCP display filters option allows you to define a set of
parameters that determine which connections the Traffic
Monitor displays about. Selecting this option
pops up another menu with the tasks used to define and apply
custom TCP display filters.
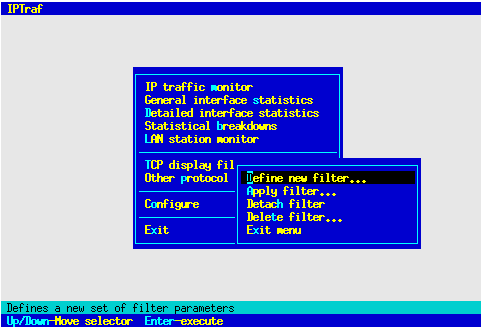
A freshly installed program will have no filters defined, so
before anything else, you will have to define a filter. You
can do this by selecting the Define new filter... option.
To recognize the host 207.0.115.44
        Enter IP address:	207.0.115.44
        Wildcard mask:          255.255.255.255

To recognize all hosts belonging to network 202.47.132.x
        Enter IP address:       202.47.132.0
        Wildcard mask:          255.255.255.0

To recognize all hosts with any address:
        Enter IP address:       0.0.0.0
        Wildcard mask           0.0.0.0
The IP address/wildcard mask mechanism of the display filter
doesn't recognize IP address class. It uses a simple bit-
pattern matching algorithm.
Tip
See the Linux Network Administrator's Guide if you need more
information on IP addresses and subnet masking.
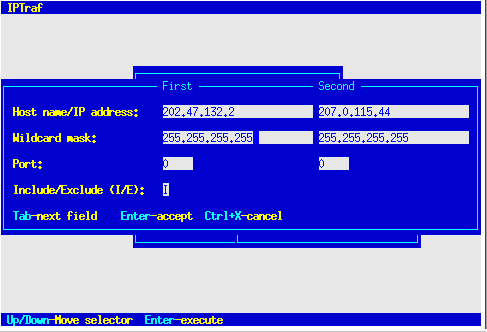
To see all traffic to/from host 202.47.132.1 from/to
207.0.115.44, regardless of TCP port
Host name/IP Address    202.47.132.2            207.0.115.44
Wildcard mask		255.255.255.255		255.255.255.255
Port                    0                       0
Include/Exclude         I
To see all traffic from/to 207.0.115.44 to/from network
202.47.32.0
Host name/IP Address    207.0.115.44            202.47.132.0
Wildcard mask		255.255.255.255		255.255.255.0
Port                    0                       0
Include/Exclude         I
To see all Web traffic, regardless of source or destination
Host name/IP Address    0.0.0.0                 0.0.0.0
Wildcard mask		0.0.0.0			0.0.0.0
Port                    80			0
Include/Exclude         I
To see all mail (SMTP) traffic to a single host
(202.47.132.2) from anywhere
Host name/IP Address    202.47.132.2            0.0.0.0
Wildcard mask		255.255.255.255		0.0.0.0
Port                    25                      0
Include/Exclude         I
To see traffic to/from host sunsite.unc.edu from/to cebu.mozcom.com
Host name/IP Address	sunsite.unc.edu		cebu.mozcom.com
Wildcard mask		255.255.255.255		255.255.255.255
Port			0			0
Include/Exclude         I
To omit display of traffic to/from 140.66.5.x from/to anywhere
Host name/IP Address    140.66.5.x              0.0.0.0
Wildcard mask           255.255.255.0           0.0.0.0
Port                    0                       0
Include/Exclude         E
In all cases, you could have interchanged the first and
second sets of IP addresses, wildcard masks, and port
values; they wouldn't have made any difference. That's why
they're better referred to as "first" and "second" rather
than "source" and "target".
Filters follow an "implicit no-display" policy, that is, only
explicitly defined sites will be displayed, everything else is not.
This is similar to the access-list policy "whatever is not explicitly
permitted is denied". If you want to show all traffic to/from
everywhere, except certain places, you can specify the sites
you wish to exclude, mark them with E in the Include/Exclude field,
and define a general catch-all entry with source address 0.0.0.0,
mask 0.0.0.0, port 0, and destination 0.0.0.0, mask 0.0.0.0, port 0, tagged
with an I in the Include/Exclude field as the last entry.
Host name/IP address            0.0.0.0                 0.0.0.0
Wildcard mask                   0.0.0.0                 0.0.0.0
Port                            25                      0
Include/Exclude                 E

Host name/IP address            0.0.0.0                 0.0.0.0
Wildcard mask                   0.0.0.0                 0.0.0.0
Port                            80                      0
Include/Exclude                 E

Host name/IP address            207.0.115.44            0.0.0.0
Wildcard mask                   255.255.255.255         0.0.0.0
Port                            0                       0
Include/Exclude                 E

Host name/IP address            0.0.0.0                 0.0.0.0
Wildcard mask                   0.0.0.0                 0.0.0.0
Port                            0                       0
Include/Exclude                 I
Tip
To omit all TCP from the display, define a filter with a single entry,
with a source of 0.0.0.0 mask 0.0.0.0 port 0, and a destination of
0.0.0.0 mask 0.0.0.0 port 0, with the Include/Exclude field marked E
(exclude). Then apply this filter.
The above steps only add the filter to a defined list. To
actually apply the filter, you must select Apply filter.
from the menu. You will be presented with a list of filters
you already defined. Select the one you want to apply, and
press Enter.
Select Edit filter... to modify an existing filter. Once you select
this option, you will be presented with the list of defined filters. Select
the filter you want to edit by moving the pointer and press Enter.
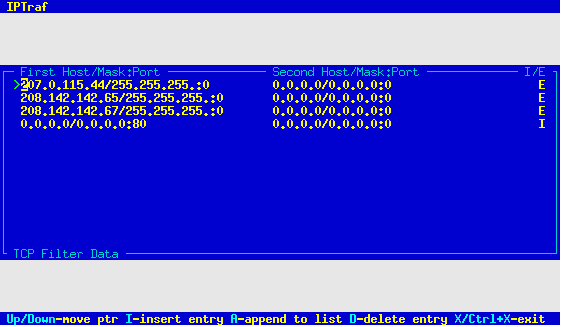
Note If you're editing the currently applied filter, you will need
to reapply the filter for the changes to take effect.
Note Be aware that the filter process the rules in order. In other
words, if a packet matches more than one rule, only the first matching rule
is followed.
Select Delete filter... from the menu to remove a filter from
the list. Just move the pointer to the filter you want to
delete, and press Enter.
The Detach filter option deactivates the filter currently in
use. Selecting this option causes all TCP information to be
displayed by the traffic monitor.
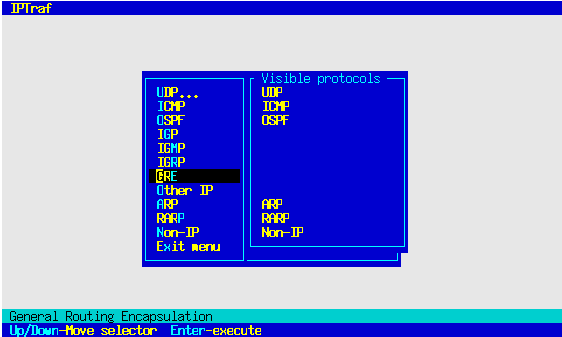
Other Protocol Filters
You can select the other IP-type protocols you want to
display or omit with the Other protocol filters... option.
With the exception of UDP, the filters for other protocols
are simply toggled. To toggle a protocol's display, just
select the protocol and press Enter. Visible protocols are
listed in the box next to the menu.
Configuring IPTraf
IPTraf can be easily configured with the Configure item in the
main menu. The configuration is stored in the
/var/local/iptraf/iptraf.cfg file. If the file is not found,
IPTraf uses the default settings. Any changes to the
configuration immediately get stored in the configuration
file.
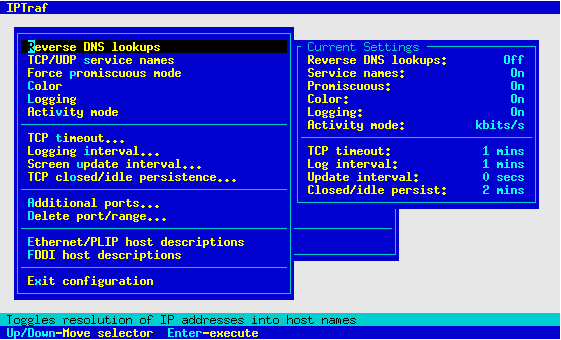
Activating reverse lookup causes IPTraf to find out the name
of the hosts with the addresses in the IP packets. As
pointed out earlier, if you're on the Internet, your
keyboard control can become very clumsy with this option
enabled, and you can lose packet counts. You may want to
keep this off if you're monitoring a machine on the
Internet, or if you have no accessible name server or host
table. A local DNS server on an isolated LAN though won't
give much trouble.
This option, when on, causes IPTraf to display the TCP/UDP service names
(smtp, www, pop3, etc.) instead of their numeric ports (25, 80, 110, etc).
The number-to-name mappings will depend on the systems services database
file (usually /etc/services). Should there be no corresponding service
name for the port number, the numeric form will still be displayed.
Note
Reverse lookup and service name lookup take some time and may impact
performance and increase the chances of dropped packets. Performance
and results are best (albeit more cryptic) with both these settings off.
If this option is enabled, your LAN interfaces will
capture all packets on your LAN. Using this option enables
you to see all TCP connections and packets passing your LAN
segment, even if they're not from or for your machine. When
this option is active in the statistics windows, the Activity
indicators will show a good estimate of the load on your
LAN segment.
Note
Do not use other programs that change the interface's
promiscuous flag at the same time you're using IPTraf. The
programs can interfere with each other's expected
operations.
Turn this on with color monitors. Turn it off with black-and-
white monitors or non-color terminals (like xterms).
Changes to this setting will take effect the next time the program is
started.
When this option is active, IPTraf will log information to a
disk file, which can be examined later. Each facility has its own log
file in (by default) the /var/log/iptraf directory as follows:
	IP Traffic Monitor              - ip_traffic.log
	General Interface Stats         - iface_stats_general.log
	Detailed Interface Stats        - iface_stats_detailed.log
	TCP/UDP Service Monitor         - tcp_udp_services.log
	Packet Size Breakdown		- packet_size.log
	LAN Station Monitor             - lan_statistics.log
Toggles activity indicators in the interface and LAN statistics facilities
between kilobits per second (kbits/s) or kilobytes per second (kbytes/s).
This figure determines the number of minutes between logging
of interface statistics, TCP/UDP figures, and LAN host
statistics. The default is 60 minutes. This figure is
meaningless if logging is disabled.
This value determines the rate in seconds at which the screen is updated.
The default is 0, which means the screen is updated as fast
as possible, giving close-to-realtime reflection of network
activity. However, this high-speed update can cause incredible
amounts of traffic if IPTraf is run on a remote termnial (e.g.
a Telnet or Secure Shell session). You can set this to a higher
value, such as 1 or 2 seconds to slow down the updates.
Note
Screen updating is one of the slowest operations in a program. Older
versions of IPTraf had a problem once network activity became very high.
Because each packet caused a screen update, IPTraf began spending more
time with the screen updates, causing a loss of packets once network
activity reached a certain point.
This paremeter determines the interval (in minutes) at which the IP Traffic
Monitor clears from the TCP display window all closed, idle, and timed out
entries. Enter 0 to keep such entries on the screen indefinitely,
disappearing only when replaced by new connections.
Note The TCP timeout... option only tells IPTraf how long it
should take before a connection should be considered idle and open to
replacement by new connections. This does not determine how long it remains
onscreen. The TCP closed/idle persistence... parameter flushes
entries that have been idle for the number of minutes defined by the TCP
timeout... option.
Select this item to enter a port number to be included in
the TCP/UDP counts in the TCP/UDP service statistics main
menu item described above. By default, port numbers above
1023 are not monitored. If you do have a higher-numbered
port to monitor, enter it here.
Select this item to remove a higher-numbered port number or port range you
entered earlier with the Additional port... option. A window will
come up containing the entered ports and ranges. Select the entry you
want delete and press Enter.
LAN Station Identifiers
The LAN station statistics facility monitors stations based on their
respective MAC addresses. The hexadecimal notation of these addresses
make them even more difficult to remember than the dotted-decimal IP
addresses, so these facilities was added to help you better find which station
is which.
Note
The description file for Ethernet and PLIP is ethernet.desc,
while the FDDI descriptions are stored in fddi.desc in the IPTraf
working directory. These files are in colon-delimited text format.
Database engines or custom scripts can be told to
append data lines to those files. Each line follows this simple format:
address:description
For example
Background Operation
IPTraf's facilities can be placed in the background solely for logging.
When running in the background, it doesn't display any output on the
screen, and doesn't receive input from the keyboard, and drops you back to
the shell.
iptraf -i all -B
iptraf -d eth0 -t 5 -B
ps x
at the command line, and find the process id (pid) of the iptraf process
you're looking for. Then send that process a USR2 signal with the
kill command:
kill -USR2 pid
Messages
Unable to create config file
IPTraf cannot create the configuration file. The most
likely cause of this is that you didn't properly install the
program, and the necessary directory /var/local/iptraf does
not exist. Can also be generated if you have a disk problem
or if you have too many files open.
The configuration record cannot be read. You most likely
have a disk problem.
The configuration file cannot be written. You either have a
disk problem, or (more likely), your disk is full.
IPTraf cannot access the list of defined TCP or UDP filters.
Can also be an indicator of a bad disk.
The filter list file cannot be written to. You may have trouble accessing
your filters.
IPTraf cannot read the filter data off the file. Could be
caused by a bad disk.
IPTraf cannot open the filter file. Could be caused by a shortage of file
descriptors or a bad disk.
IPTraf cannot add the newly defined filter to the filter
list.
IPTraf cannot create the filter record file. The defined filter is lost.
IPTraf cannot create the filter data file.
IPTraf cannot save the name of the current TCP filter. IPTraf will start
with no filters active the next time it is invoked.
The saved filter cannot be retrieved. IPTraf will start with no TCP filters
active.
IPTraf was not able to write the filters for the other protocols. Probably
due to a bad disk or full filesystem.
IPTraf was unable to save the flags of the network interfaces. This is probably due to a
bad installation or full filesystem.
IPTraf was unable to retrieve the save interface flags. Probably again due to a bad
installation or full filesystem.
Another IPTraf process is modifying the TCP or UDP filter data, and has
locked the files. Try again once the other IPTraf process has terminated
or completed its modifications and unlocked the files.
The indicated host name in the filter cannot be resolved into an IP address.
Check the local hosts database /etc/hosts or your machine's DNS
configuration or DNS server.
IPTraf cannot open the file containing the descriptions for Ethernet
or FDDI addresses. Could be due to a bad disk or a hit on the file descriptor
limit.
IPTraf was unable to write the description record for this Ethernet or FDDI
address. Could be due to a bad disk or corrupted filesystem.
You tried to edit or delete a description with no previous descriptions
defined.
There is a problem opening the log file. There is most
likely a problem with the disk, or there are too many open
files.
IPTraf was unable to retrieve the list of network interfaces from the
/proc filesystem. This may be due to a badly configured kernel.
IPTraf needs /proc filesystem support.
The system call to retrieve the interface's flags failed. Check your
interface or kernel driver.
The system call to change the promiscuous flag failed. Check your interface
or its kernel driver.
IPTraf was unable to open the necessary socket for the promiscuous change
operation. May be due to a shortage of file descriptors.
Returned by the facility for detailed interface statistics if the raw
socket's opening sequence failed. The facility will abort.
IPTraf was unable to open the raw socket for packet capture. May be due
to a shortage of file descriptors.
Reminder IPTraf 2.x.x requires Linux kernel 2.2.x, with the Packet
Socket option compiled in or installed as a module. IPTraf 2.x will
return this error on a pre-2.2 kernel or on a 2.2 kernel without Packet
Socket.
The detailed statistics facility was unable to obtain the maximum
transmission unit (MTU) for the selected interface. The facility will
abort.
The interface specified with the -i, -d, -s,
-l or -z
command-line parameters is not supported by IPTraf.
The interface specified with the -i, -d, -s,
-l or -z
command-line parameters is supported, but not currently activated.
May occur if you have too little memory to allocate for windows, the
menu system, or dialog boxes. IPTraf tries to prevent further
allocations if memory runs out during a monitor. However, this could
also mean a bug if you're reasonably sure you're not out of memory.
An instructional message on bug reporting follows this message.
Technical note: This is actually a response to the segmentation fault
error (SIGSEGV).
IPTraf normally does not allow anybody but uid 0 (root) to run it. This
measure is included for safety reasons. See the section on recompiling
the program below if you want to override this. This feature is built
in, and not part of the configuration
The TERM (terminal type) environment variable must be set to a valid
terminal type so that the screen management routines can function
properly. Set it to the appropriate terminal type. Linux consoles
typically use a value called "linux".
Not related to the previous message. The TERM (terminate) signal is
normally used to
gracefully shut down a program. This message simply indicates that the
TERM signal was caught and IPTraf is attempting to shut down as gracefully
as possible.
The -i, -d, -s, -z or -l
options were specified but no interface was specified on the command line.
These parameters require a valid interface name (or all for
-i or -l).
IPTraf normally tags itself when it runs to prevent multiple instances of
the statistical facilities from running. This message means the program was
unable to create the necessary tag file. This may be due to a bad or improper
installation. Try running the "make install" procedure.
IPTraf was unable to create the tag file for the facility you started.
The facility will still run, but other instances of IPTraf that may be
running simultaneously will allow the same facility to run. This may cause
both instances of the facility to malfunction. This could be due to a bad
disk or bad installation.
The facility you tried to start is currently running in another IPTraf
process on the machine. This restriction is placed to prevent conflicts
involving internal sockets or the log file.
You entered a port number or range that was already added to the list of
additional ports to be monitored by the TCP/UDP service monitor
There are no ports or port ranges earlier added. There's nothing to
delete.
IPTraf cannot start the rvnamed daemon; probably due to a bad installation.
IPTraf will fall back to blocking lookups.
IPTraf cannot start a new process. This may be due to memory shortage.
IPTraf will fall back to blocking lookups.
IPTraf cannot start a new process, and can go into the background. This
may be due to memory shortage. IPTraf aborts.
IPTraf was unable to allocate memory for a new filter entry. Most likely
due to memory shortage.
This indicator appears if memory runs low due to a lot of entries in a
facility. Should critical functions fail (window creation, internal
allocation), the program could terminate with a segmentation violation.
This indicator appears if an error occurs receiving data from the rvnamed
program (IPC stands for Interprocess Communication). This indication should
not occur under normal circumstances. Report instances of this condition
and the circumstances under which it happens. You may also include data
from the rvnamed.log file.
The screen management routines cannot find the terminfo entry for your
terminal. IPTraf expects the terminfo database located in
/usr/share/terminfo. This error could occur when your terminfo
database is located somewhere else.
rvnamed Messages
rvnamed was unable to open the communication endpoint for data reception
from the children it creates. This is highly unusual, and should it occur,
report the circumstances.
rvnamed was unable to open the communication endpoint for data exchange with
the IPTraf program. This is highly unusual, and should it occur, report
the circumstances.
Error binding child communication socket
rvnamed was unable to assign a name to the indicated communication socket.
This may be due to a bad, full, or corrupted filesystem.
rvnamed ran out of memory. IPTraf will resort to blocking, and may freeze.
rvnamed had a problem spawning a copy of itself to resolve the IP address.
rvnamed will simply return the IP address in its literal, dotted-decimal
notation. IPTraf will still function normally. This may be due to lack
of memory or a process limit hit.
Technical Appendices
Recompiling the Program
With both the downloaded and floppy distributions, you can
recompile the program immediately before you do the make
install. Perform the following steps to recompile:
make clean
make
at the prompt. You may want to recompile force the program
to use your libraries and/or kernel sources, or to simply
generate smaller executable files.
Makefile Options
The Makefile has several options you can change. You
probably don't need to change most of them, probably with
the exception of LDOPTS
make install
to install the resulting executable modules in the proper directory.
Technical Notes
(also in the README file)
Kernel
IPTraf 2 requires the 2.2.x series of the Linux kernel. If you still have
Linux 2.0, continue using IPTraf 1.4. You must make sure your 2.2 kernel
has the Packet Socket functionality compiled in or installed as a module, or
IPTraf will fail.
Security
The raw socket interface requires the program to run with
root permission. This program is intended for system and
network administrators. However, should you want to allow
non-root users to use the program you can edit the Makefile
and enable the -DALLOWUSERS option, then install the
program setuid root. This is not recommended though. While
effort has been exerted to avoid things like buffer
overruns, this program is not declared to be secure for non-
root users to use.
Terminal
This program was designed to run on the Linux console. It
should work on 80x25 xterms and rxvt windows. Run this
program from the console (text or xterm) or a high-speed
terminal for best results. Resize xterms to the appropriate
size before you run the program.
User Interface
Reverse DNS lookups will block if the rvnamed daemon is not
running when the traffic monitor is active. This will cause
severe packet loss and keyboard control close to impossible.
Normally rvnamed should start with no problems whenever the
traffic monitor is started with reverse lookups enabled.
Network Interfaces
IPTraf currently includes support for Ethernet, FDDI, loopback,
asynchronous SLIP/PPP, PLIP, and ISDN (synchronous PPP, Cisco-HDLC, and
raw IP encapsulations).
License and Copyright for IPTraf
IPTraf 2.3 Copyright © Gerard Paul Java, 1997-2000
IPTraf User's Manual, HTML Version 2.3.0
Copyright © Gerard Paul Java 1997-2000